Technical Analysis of Financial Markets
-
▼
2006
(71)
-
▼
June
(13)
- Dow Jones - Inverse Head & Shoulders
- Apple Computer, Inc. (AAPL) - Adam & Eve Double Bo...
- Insteel Industries, Inc. (IIIN) - Inverse Head & S...
- Dell Inc. (DELL) - Possible Double Bottom
- Dow Jones - A Setup Rally ?
- FTSE 100: End of Bull-Market 20/03/2003 to 13/06/2...
- 10% Correction ?
- Hansen Natural Corp. (HANS) - Descending Triangle ...
- Dupont Co. (DD) - Head & Shoulders ?
- Dow Jones - Bear Hug
- Take-Two Interactive Software, Inc (TTWO)
- Peregrine Pharmaceuticals, Inc (PPHM) - Bullish Sy...
- NutriSystem, Inc (NTRI) - Diamond Top ?
-
▼
June
(13)
Friday, June 30, 2006
Dow Jones - Inverse Head & Shoulders
The Dow seems as if it has formed a rather sneaky looking bullish Inverse Head & Shoulders pattern. The Fed rally today caused a breakout of the Neckline occurring at the 38.2% Fibonacci advancement level from the selloff low. The rally seems to have hit resistance at the 50-day moving average occuring near the 50% Fibonacci advancement level. Technically, the price projection of a Head & Shoulders formation is the distance measured from the Head to the Neckline projected from upwards from the Neckline; -this translates to a price projection of 11,500 approx. However, retracments back to the Neckline providing support are possible before heading higher. A break and close below the Neckline invalidates the formation.
Saturday, June 24, 2006
Apple Computer, Inc. (AAPL) - Adam & Eve Double Bottom ?
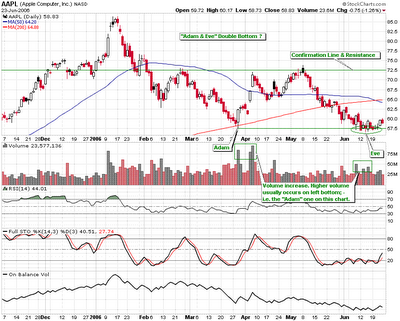
Apple seems to be attempting to form an Adam & Eve double bottom pattern. The left "Adam" bottom is identified with a spike. The "Eve" bottom forms gradually creating a rounded base. Higher volume on the left bottom usually indicates a stronger pattern. However, the pattern seems to be in very early stages and is confirmed on break of the Confirmation Line which serves as prior resistance. From then on, a price projection to the previous high of $85 is a possible target.
Thursday, June 22, 2006
Insteel Industries, Inc. (IIIN) - Inverse Head & Shoulders
Breaking above the 50-day moving average, IIIN looks like it has formed a bullish inverse Head & Shoulders pattern. A break of the $22 Neckline resistance will confirm the pattern at which point a buy signal is generated. For a lower-risk entry, look for a possible pullback to the Neckline after the breakout which should act as support as "old resistance becomes new support". Price projection: $28 - distance from the Head to Neckline projected upwards from the Neckline, filling a gap along the way.
Wednesday, June 21, 2006
Dell Inc. (DELL) - Possible Double Bottom
Calling the bottom in Dell is like catching a falling knife. However, with stochastics oversold and looking to turn higher, it seems that a bullish Double Bottom pattern is forming. A break above $26 dollars completes the formation with support at the 50-day moving average. From then on, a possible price projection of $28.50 may provide the next level of resistance. Invalid pattern if close below support at $23.50.
Friday, June 16, 2006
Dow Jones - A Setup Rally ?
A strong 200-point rally today on ordinary volume may have completed a limited two-day rebound. At 11,100, a visit to the recent Head & Shoulders neckline is met with the nearby 38.2% Fibonacci retracement level from the selloff high. This point may provide short-term resistance which could be a good entry point to short positions. The chart below may suggest that short-term resistance could be encountered sooner at around 11,050. The selloff that began month ago has created a downtrend channel; the current upside resistance of the channel is at 11,050 where it meets the Bollinger midpoint. So, a number of resistance levels here, in summary: Bollinger midpoint and current upside resistance of downtrend channel at 11,050, next, 38.2% Fibonacci advancement level from the selloff lows at 11,068 and finally 11,100 neckline level of the recent Head & Shoulders. The average of these resistance levels is 11,075. A break and close tomorrow above 11,100 should see a follow-through rally into next week testing the 50-day moving average at around 11,225. Otherwise, a selloff tomorrow at the discussed resistance levels bodes for more range-bound declines next week within the downtrend channel.
Wednesday, June 14, 2006
FTSE 100: End of Bull-Market 20/03/2003 to 13/06/2006 ?
"Operation Iraqi Freedom", the invasion of Iraq began on 20/03/2003. The following morning the FTSE (including other major global indices) dipped to the lowest point of the dotcom-crash and 911 bear-market and then bounced some 6% beginning a bull-market trend reversal. The trend reversal has been intact and in a consistent uptrend ever since--until today 13/06/2006. The uptrend which had lasted 1180 days tested the trendline 6 times and managed to rebound off it successfully. However, today, on the 1181st day of the uptrend, the FTSE has broken and closed beneath it. Closing below 5500 is more than a 10% correction. A weekly close below this major bull-market trendline signifies a trend reversal as “old support becomes new resistance”. Retracements back up to the trendline (now resistance) should provide good short entry positions. A 20% decline is widely seen as a bear-market and would equate to the 5000-level on the FTSE 100.
Monday, June 12, 2006
10% Correction ?
The declines in the Russell 2000 index of smaller companies and the tech-weighted Nasdaq today have contributed to a 10% pullback from the year highs from each of the indices; a drop of 10% is considered a full-fledged correction, which is an interruption of a general bull market trend. The above chart of the S&P500 illustrates a close below the 200-day moving average and 1245 key support. The index has closed resting on an uptrend which has been providing support for the past 35 months. A close below this support provides a good entry for short positions as "old support becomes new resistance". Finally, if the S&P500 is following the Russell and Nasdaq into a 10% correction, the 38.2% Fibonacci retracement level at ~1190 from the year high should provide support.
The Dow, if too, is following the other major indices into a 10% correction, should find support at approx 10,550 where it meets the uptrend support which has been intact over the past 35 months since July 2003:
Friday, June 09, 2006
Hansen Natural Corp. (HANS) - Descending Triangle Breakdown ?
It looks as if HANS is showing showing signs of a pullback; it seems that a Descending Triangle formation has completed. The base of the triangle which had been providing support at $170 should now serve as resistance and a good short entry point. Immediate support is currently at around $155 where a previous gap has been filled meeting with the 50-day moving average and 38.2% Fibonacci retracement level of a parabolic uptrend that began in February. OBV is confirming the breakdown; however, volume lacks conviction.
Wednesday, June 07, 2006
Dupont Co. (DD) - Head & Shoulders ?
On economic growth concerns, Deutsche Bank today downgraded Dupont. From a TA perspective, it looks as though a Head & Shoulders formation is completing. The neckline at approx $42 seems to be providing support which coincides with the 38.2% Fibonacci retracement level from the Oct 2005 trendline high. The price projection of a Head & Shoulders pattern is usually the distance from the head to the neckline projected downwards from the neckline; i.e., approx sub-$39. However, support may be found at the 61.8% Fibonacci retracement level where the Oct 2005 trendline continues.
Tuesday, June 06, 2006
Dow Jones - Bear Hug
So many bearish signals on the Dow. It all started with a breach of the Oct 2005 trendline which now has become resistance along with the 50-day moving average. Next, the 38.2% Fibonacci retracement level from the year high which had been providing support over the last week fell through. A Head & Shoulders formation looks complete with a breach of the neckline. A possible retrace to test the neckline and 38.2% Fibonacci level may provide a good entry point to load-up on short positions. Finally, it looks as if an Elliot Wave has somewhat formed; which if correct, may see the Dow retrace to the 61.8% Fibonacci level passing through the 200-day moving average.
Monday, June 05, 2006
Take-Two Interactive Software, Inc (TTWO)
Multiple levels of resistance here, first at the 50-day moving average. If it overcomes that then next resistance is the June 2005 downtrend-line where it meets resistance at the 200-day moving average. Overcoming the 200-day moving average and June 2005 downtrend-line puts it in the path to contest with the 61.8% Fibonacci retracement level from the June 2005 high where the downtrend began. Volume and OBV should dictate whether these resistance levels can be overcome. Cross-post: http://www.thebulltrader.com/forums/index.php?topic=164.0
Peregrine Pharmaceuticals, Inc (PPHM) - Bullish Symmetrical Triangle Breakout
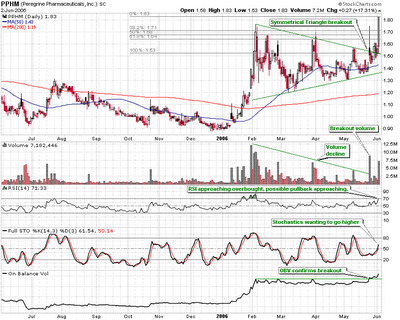
PPHM has broken out to the upside of a Symmetrical Triangle formation. The pattern forms on declining volume and a breakout is confirmed with a surge in volume. Additionally, the OBV has confirmed the breakout with smart money flowing in. RSI is approaching the overbought region so a pullback may be due at which point may represent a good re-entry point - watch Fibonacci levels for possible support; 38.2% retracement is a 6% pullback at $1.71 approx.
Thursday, June 01, 2006
NutriSystem, Inc (NTRI) - Diamond Top ?
NTRI looks as if it has formed a Diamond Top which is usually bearish. The on balance volume is flatlining, money flow seems stagnated - in or out. Trade in the direction of the breakout; if down, then a visit to at least the 50-day moving average sub-$60 level may be possible. Cross-post: http://www.thebulltrader.com/forums/index.php?topic=170.0
Subscribe to:
Posts (Atom)