Technical Analysis of Financial Markets
Wednesday, November 29, 2006
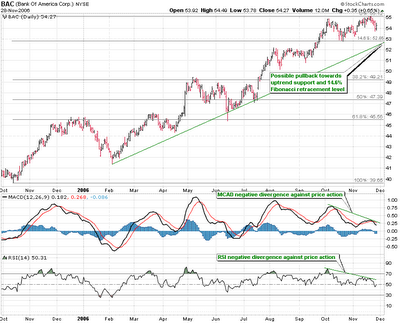
Bank of America (BAC) – Negative Divergence
Bank of America has recently surpassed rival Citigroup to become the largest US retail bank in terms of market capitalization valuing the firm at $243.71 billion. An 11-month uptrend has seen stock price rally some 40% hitting new all-time highs. However, the recent all-time highs in price action have been occurring with declining RSI and declining MACD; -implying a bearish negative divergence. An initial price target for a short-sell position would be at the 14.6% Fibonacci retracement level coinciding with the uptrend support. On break of the trendline, other levels of support may include $52 and the 38.2% Fibonacci level. Stop-loss: close above $55.
Tuesday, November 28, 2006
Dow Jones
The Dow has broken and closed beneath the support of an uptrend which saw a rally gaining some 15% in just 4 months. The breakdown of the trend has currently found support at the 14.6% Fibonacci retracement level, or 12116. This breakdown may mark the beginning of a trend-reversal with a progressive downtrend towards support at the 38.2% Fibonacci level; -so as long price action does not trade and close back above the trendline at around 12250. It may be worth noticing how the RSI trendline flipped from support to resistance coinciding with the commencement of negative divergence of MACD against price action as a possible warning of the weakening trend.
Friday, November 17, 2006
Exxon Mobil Corp. - (XOM)
Exxon has seemingly broken a short 2-month uptrend which saw stock price rally some 18%. Should price action trade and close below the trendline, old support will become new resistance with Fibonacci retracement levels serving as support levels. Initial price target at 38.2% Fibonacci retracement level ~$70.64. Stop loss close above $73.50.
Wednesday, November 15, 2006
Nektar Therapeutics - (NKTR)
Biopharmaceutical and drug delivery technologies company Nektar Therapeutics has been declining for seven months losing some 80% in stock price. The decline is much correlated with the delay in launching insulin inhaled drug Exubera managed by marketing partner Pfizer. However, a recent breakout of the downtrend occurring three trading sessions ago may signal the beginning of a trend-reversal.
Tuesday, November 14, 2006
JetBlue Airways Corp. - (JBLU)
JetBlue has completed a Double Bottom formation reversing a 32-month downtrend which saw stock price decline some 122% in that period. A usual price target for a Double Bottom formation can be measured by taking the height of the Double Bottom 'W' pattern and projecting it upwards; - a price target of around $16.75. However, RSI is indicating that conditions are currently overbought; possible pullback towards supports at ~$13 and ~$12.15 before resumption of the trend. Barron's interviewed Richard Arvedlund, founder of Cypress Capital Management who picks JetBlue believing it stands to profit from falling oil prices and rates: http://biz.yahoo.com/seekingalpha/061112/20388_id.html?.v=1
Sunday, November 12, 2006
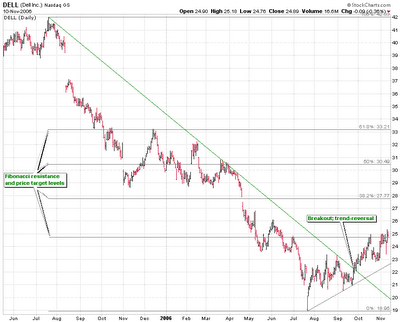
Dell, Inc. - (DELL)
Dell has been in a downtrend for over the past 18 months declining some 120% in that period. However, a breakout of the downtrend occurring end of October has seen stock price beginning a possible trend-reversal. Long-term long. Dell reports earnings next week Thursday.
Monday, November 06, 2006
XM Satellite Radio Holdings, Inc. - (XMSR)
XMSR surged more than 15% Monday after the company reported a narrower third-quarter loss and issued a better than expected forecast for 2006. However, stock price of the satellite radio service company has been in a steep decline over the past 14 months shedding some 236%. Today’s news has broken-out from the downtrend and may signal a trend-reversal. A close above $14 may complete a double-bottom formation for an initial price target of $17; from then on, seek a price target towards the 38.2% Fibonacci advancement level at around $20.50. Stop-loss close below $11.
Builders FirstSource, Inc. - (BLDR)
Operating principally in south eastern US, Builders FirstSource, supplier of structural building materials to homebuilders, has been in a downtrend for over 6 months eroding some 70% in price action. A month ago, price action broke-out from the downtrend and seems to be trading sideways; possibly a trend-reversal. Go long; stop-loss close below $15.
Sunday, November 05, 2006
NASDAQ-100 (QQQQ)
The NASDAQ-100 Index Tracking Stock of the largest non-financial companies listed on the NASDAQ has broken below the uptrend support of the late summer rally which saw a 20% gain in price action in just over 3 months. The past two trading sessions have been unable to sustain a close above the uptrend support which now seems to be acting as resistance. A weekly close below this trendline may indicate a trend-reversal. Enter short-sell position for a target towards the 38.2% Fibonacci retracement support level of the uptrend. Stop-loss: close above $43.
Subscribe to:
Posts (Atom)