Technical Analysis of Financial Markets

Wednesday, August 16, 2006

AMEX Oil Index (XOI) - Negative Divergence


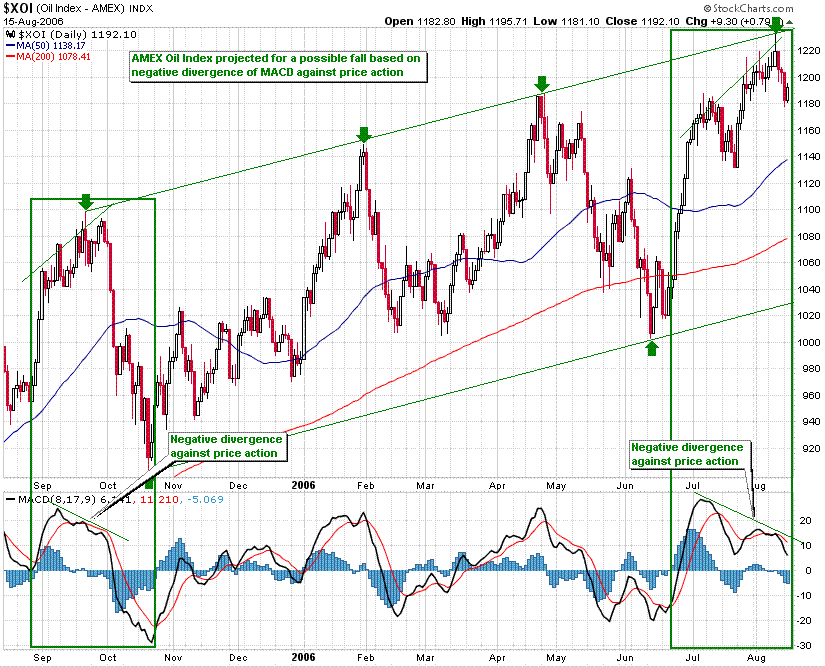
During early Sep and late Oct 2005, the MACD indictor formed a negative divergence against price action for nearly 2 months; subsequently the AMEX Oil Index plunged. The same negative divergence of MACD against price action on a similar 2 month scale is currently in progress beginning early July 2006. A break of support at 1180/1160 may signal a move lower on a similar scale as during Oct 2005 bringing price action down to the lower end of the trading range; oil stocks may be poised to fall.

Saturday, August 12, 2006

Exxon Mobil Corp. (XOM)


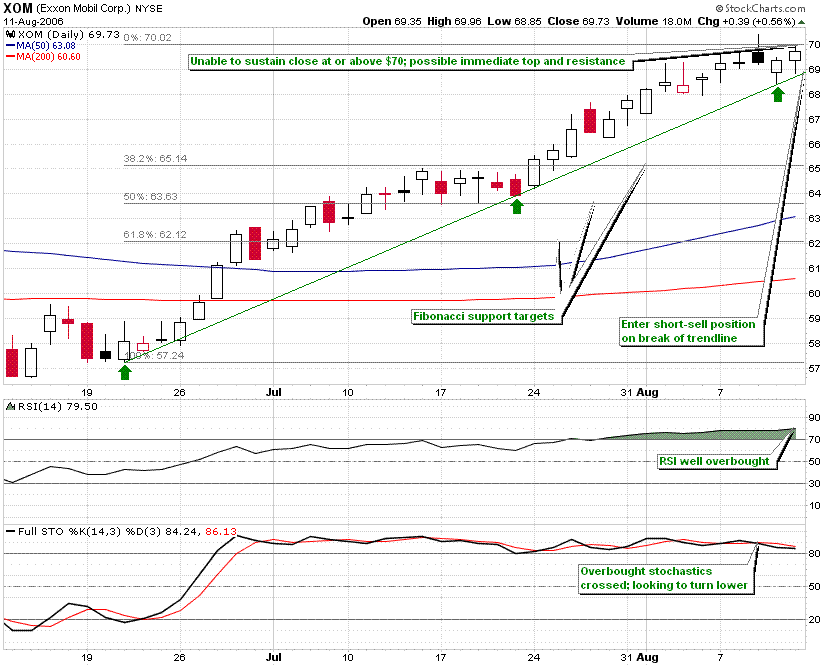
ExxonMobil recently hit an all-time high of over $70 but has been unable to close at or above that level. A 2-month uptrend driven by record $10US billion earnings profit news due to record oil prices seems intact. However indictors such as the RSI are signalling well overbought conditions, and overbought stochastics have crossed attempting to turn lower. Short-sell on break of the uptrend for a lower-risk entry. Fibonacci retracement levels of the trend may serve as possible support levels. Stop-loss: break & close above $70. Deutsche Bank has a "buy" rating (July 28th) on ExxonMobil with a target price raised from $67 to $75.

Thursday, August 10, 2006

Cisco Systems, Inc (CSCO)


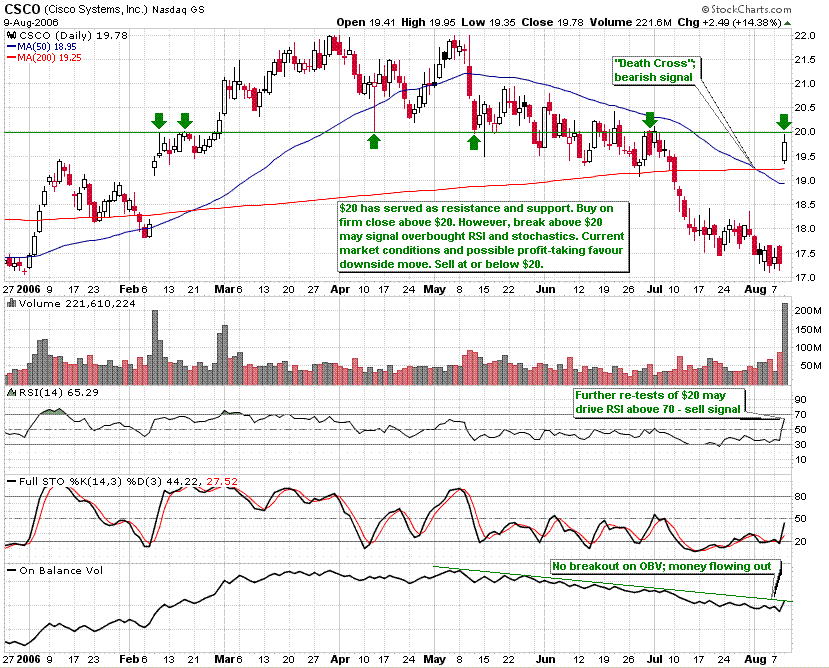
Positive earnings news from Cisco sent the stock surging 15%; however price action remained below $20 and OBV is yet to show signs of fresh buying interest. The $20 level has historically served as support and resistance. Should $20 act as resistance again, current market conditions and profit-taking may drive prices lower. The 200-moving average has crossed above the 50-day moving average; since long-term indicators carry more weight, this may indicate a bearish signal.

Tuesday, August 08, 2006

Dow Jones - Day before the Fed


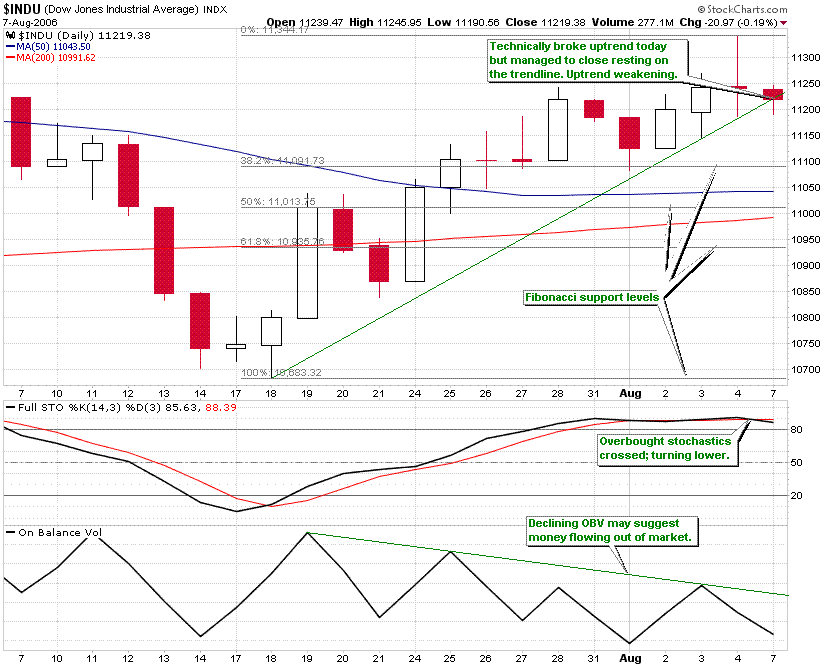
Today penetrated a 13-day uptrend but managed to close the session resting on the trendline. OBV has been declining since the uptrend began implying a divergence. Stochastics are signalling overbought conditions and have crossed looking to turn lower. Technically, the Dow seems to be weakening and ready to end the current uptrend. However, the Fed’s decision on interest rates tomorrow will of course steer the market.

Friday, August 04, 2006

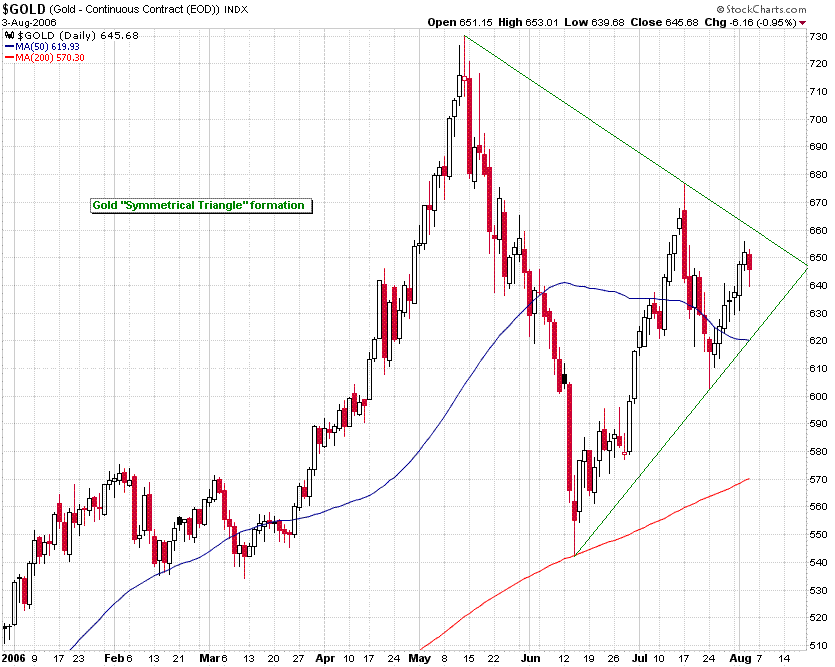
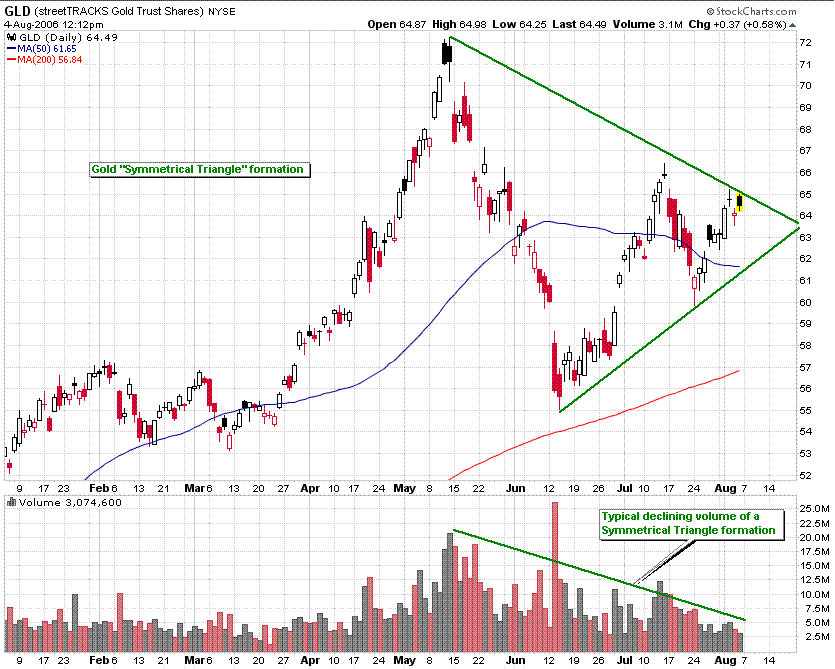
Gold & Copper - Metals Symmetrical Triangle

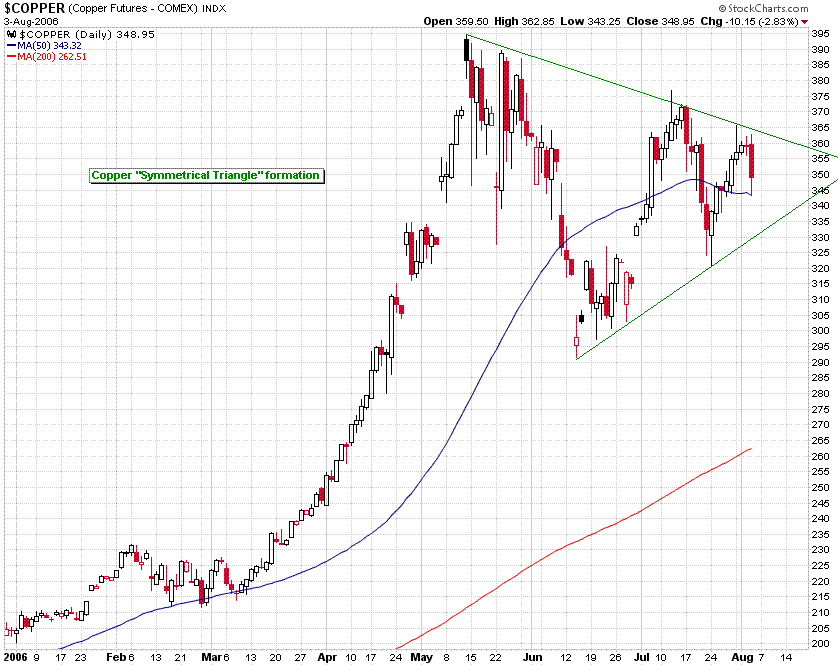
After a parabolic rise in commodities, metals copper and gold seem to be consolidating into a Symmetrical Triangle formation. Breakout usually favours the direction of the previous price trend (i.e. upwards); however, the breakout can occur in either direction - trade in the direction of breakout. Gold can be traded using the streetTRACKS Gold ETF listed on the NYSE under symbol GLD. Is there a copper ETF available?


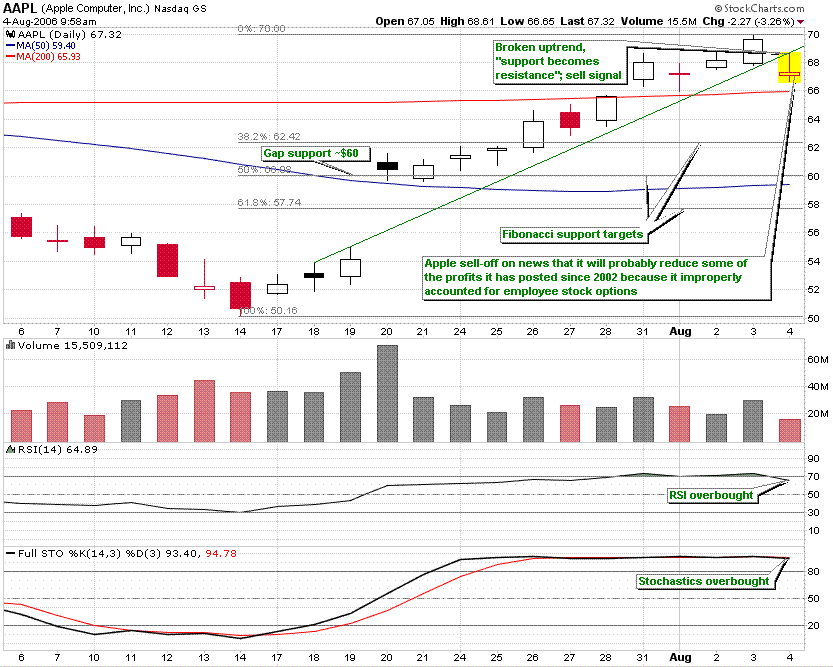
Apple Computer, Inc (AAPL)


The recent uptrend in Apple has been broken due to a sell-off on news that it will probably reduce some of the profits it has posted since 2002 because it improperly accounted for employee stock options. With RSI and stochastics signaling overbought conditions, a short-sell trade to Fibonacci retracement support levels may be possible. The 50% Fibonacci retracement level at $60 also serves as gap support. Stop-loss close above $70.

Thursday, August 03, 2006

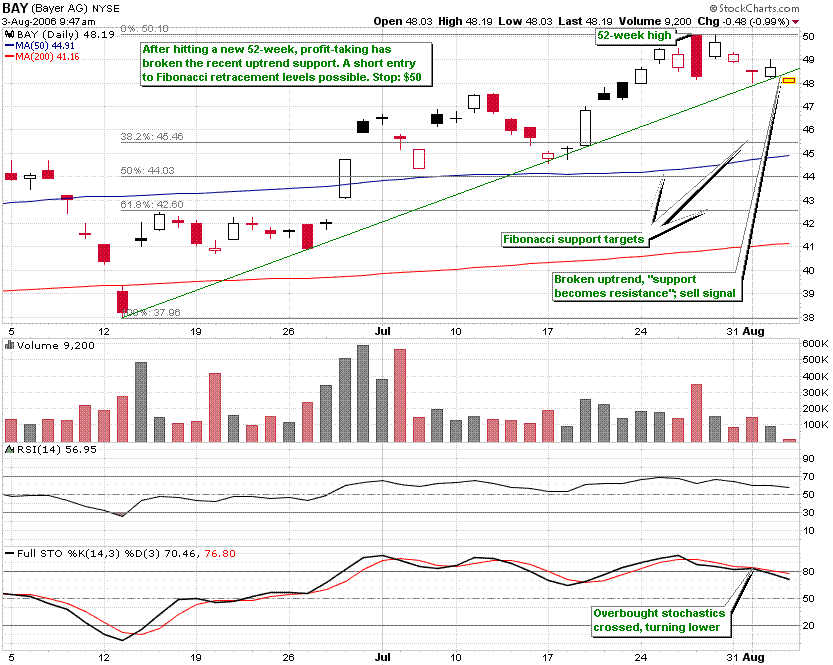
Bayer AG (BAY)


German drug manufacturer Bayer has recently hit a new 52-week high and may be subject to some profit-taking; overbought stochastics have crossed and may signal lower prices. The recent 2-month uptrend has today been breached. Current prices may provide entry to a possible short position targeting Fibonacci retracement levels. Stop-loss close above $50.

Wednesday, August 02, 2006

Pfizer, Inc (PFE)


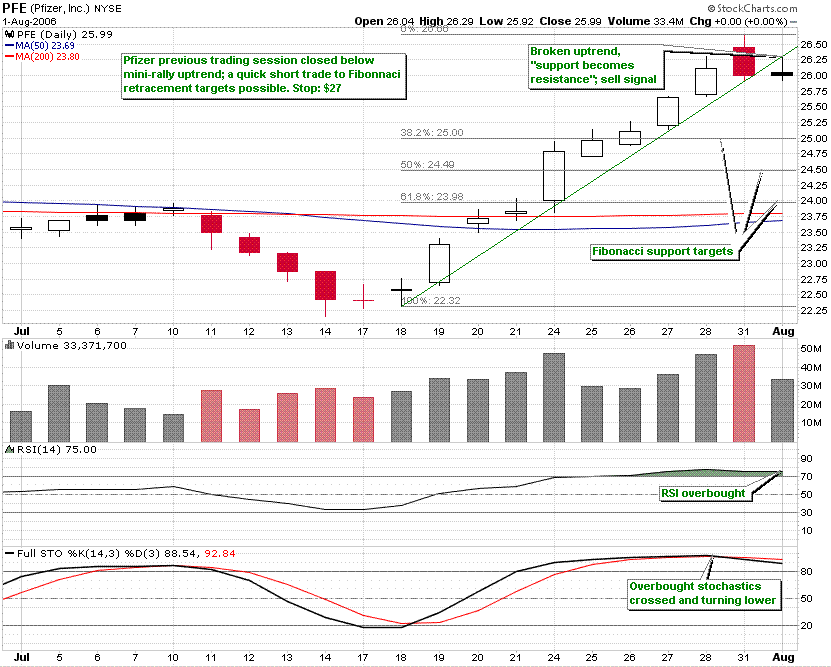
Jeffrey Kindler takes over as Pfizer’s CEO from Henry McKinnell and the stock stages a mini-rally. The previous trading session technically broke and closed below the uptrend support of the mini-rally and with RSI overbought, and overbought stochastics crossing looking to turn lower, now may be a good entry for a short position. Watch Fibonacci retracement levels for targets. Stop-loss if close above $27.

Monday, July 31, 2006

FedEx Corp. (FDX)


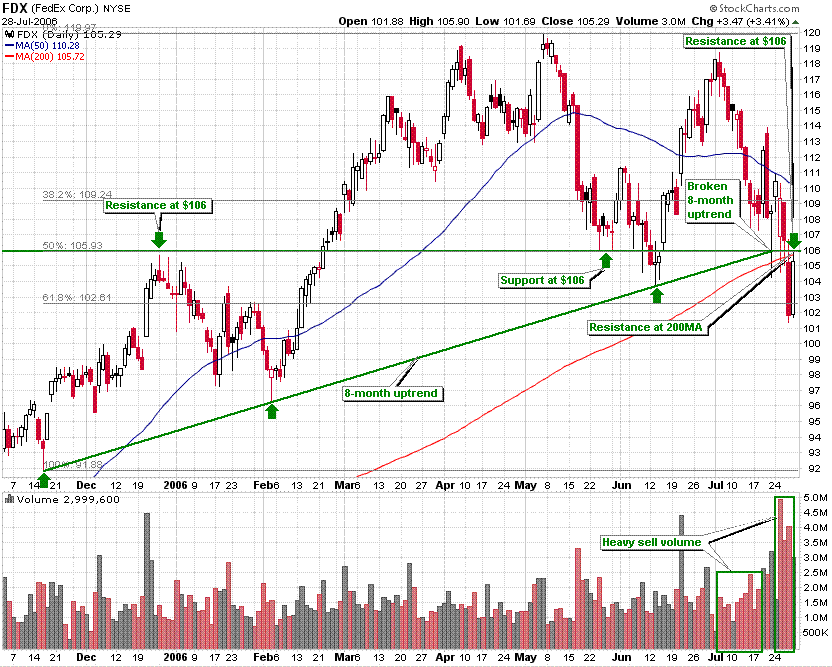
Since breaking an 8-month uptrend on July 21st, FedEx is currently trading below the 200-day moving average. $106 has served as resistance before during late December 2005 and as support during late May 2006. Currently, this level, $106, is again serving as resistance and is also the 50% Fibonacci retracement level of the 8-month uptrend. With recent heavy sell volume, bearish until firm close above $109 or 38.2% Fibonacci level.

Friday, July 28, 2006

Dow Jones – Double Bottom (almost complete)


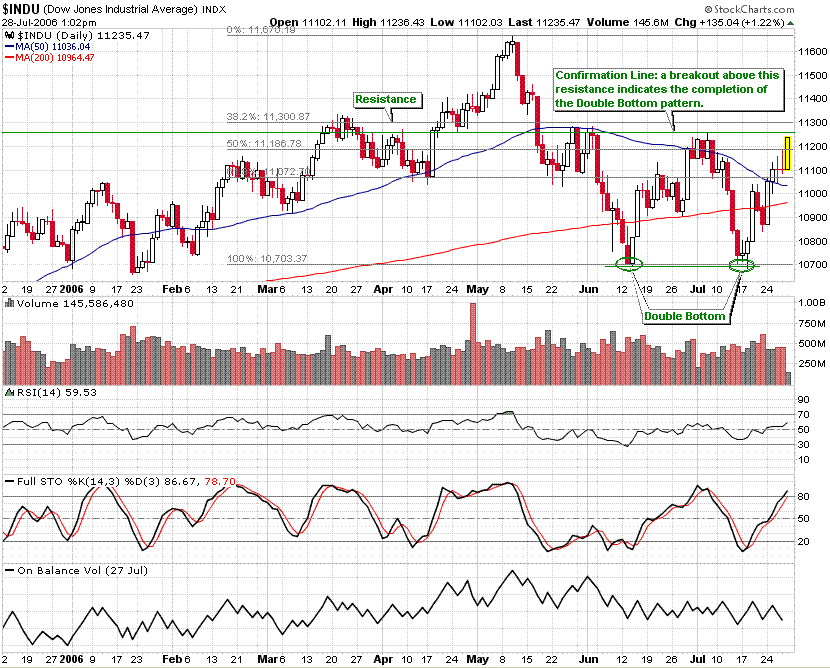
The Double Bottom bullish reversal pattern the Dow has been forming is almost complete. A break and close above approx 11,250 will confirm the pattern at which point buyers enter. However, watch 11,300 marking a Fibonnaci level which has served as resistance before during late March. A possible turn back lower below the Confirmation Line after breaking above it may indicate a failed pattern.

Starbucks Corp. (SBUX)


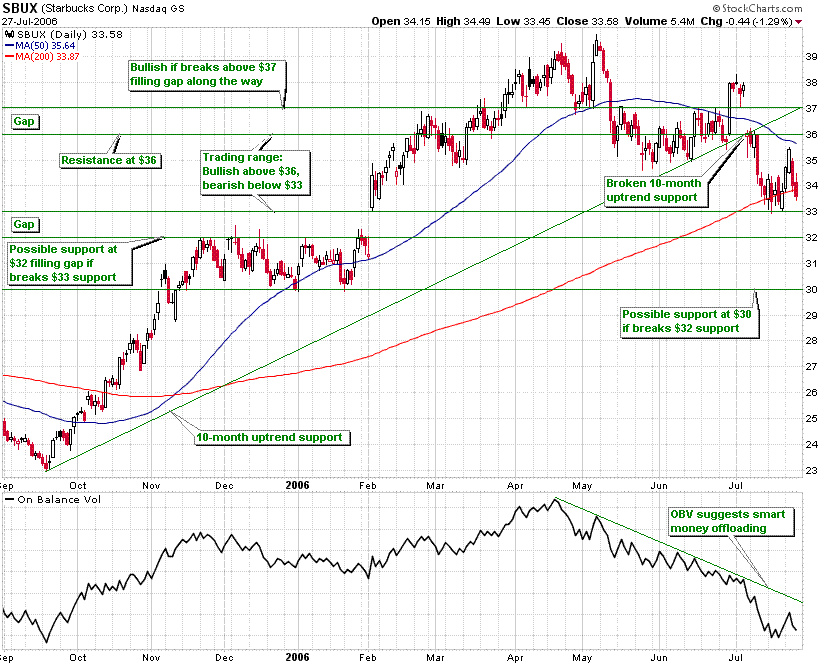
Since breaking the 10-month uptrend in early July at $36, SBUX seems to be trading between the 200-day moving average and 50-day moving average; or $33 and $36. A break of the current support at $33 should see next support at $32 filling a gap along the way. A failure of the $32 support level may see price action consolidate at around $30. Not bullish until break above $37 filling a gap along the way and climbing back above the 10-month uptrend. Declining OBV suggests smart money is offloading.

Monday, July 17, 2006

Transocean, Inc. (RIG) – Bearish Head & Shoulders Top


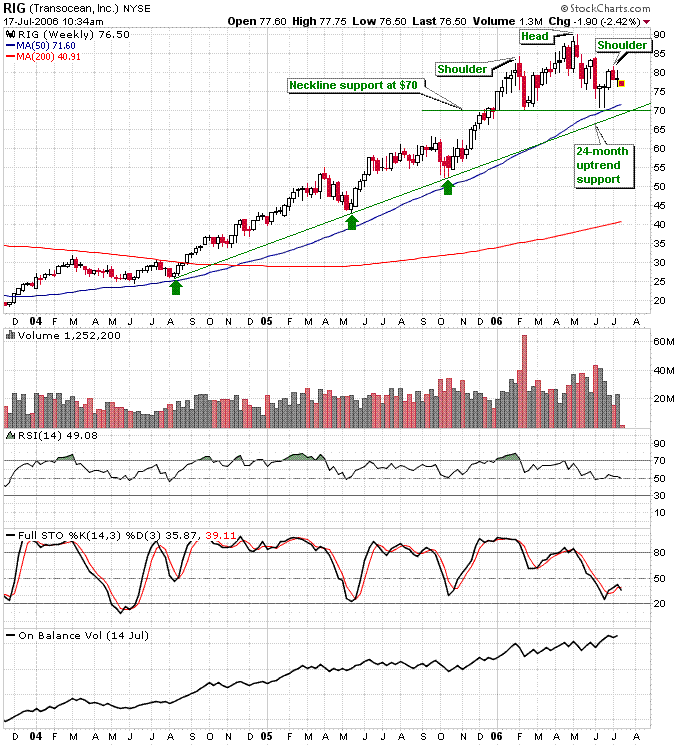
On this weekly chart, RIG seems like it is currently forming the right-shoulder of a bearish Head & Shoulders top formation. A lower-risk entry for a short-sell position may present itself on break of the Head & Shoulders Neckline at $70. This break will also take-out an uptrend that has been intact for the past 24 months.

Tuesday, July 11, 2006

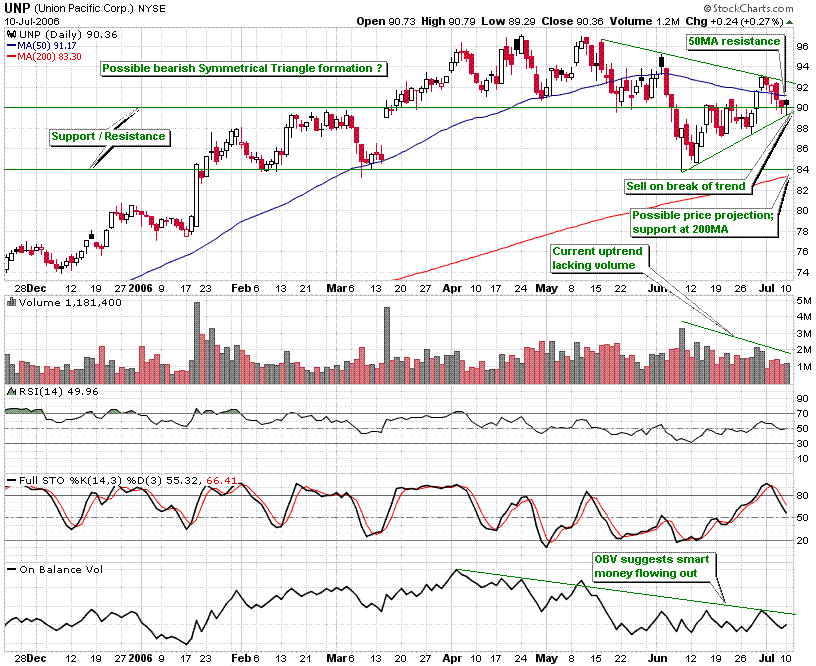
Union Pacific Corp. (UNP) - Bearish Breakdown ?


Not quite a Symmetrical Triangle, but coiling like one, UNP seems to be tightening-up preparing for a breakout. With the current uptrend forming on diminishing volume and the OBV suggesting smart money flowing out, a breakout favours the downside. Overall wider and general market direction may decide the breakout direction.

Monday, July 10, 2006

Dow Jones - Narrowing Uptrend


Previously since around April, the 38.2% Fibonacci retracement level from the highs provided Neckline support of a Head & Shoulders formation. In early June, the Oct2005 uptrend met the 38.2% Fibonacci retracement level and was broken starting the second leg of the selloff wave. Towards the middle of June, this level served as good resistance during a bounce. Friday closed almost exactly at this 38.2% Fibonacci retracement level. This level, the 38.2% Fibonacci retracement level, approx just under 11100, seems to be providing good support & resistance. If it continues to act like it has been, tomorrow should see a bounce from Friday’s close. Should the current uptrend continue from the selloff lows, then between this uptrend and the Oct2005 trendline, a narrowing trading range converges at approx 11320 which may serve as considerable resistance as before during the end of middle March. This narrowing trading range may be confirmed with declining volume.

Tuesday, July 04, 2006

Google, Inc. (GOOG) - Symmetrical Triange ?


This is a weekly chart of Google since IPO-ing. After peaking in Jan 2006, a 6-month period of consolidation creating a Symmetrical Triangle seems to be forming accompanied by declining volume; – a usual trait in any typical coiling formation. A breakout usually favours the direction of the previous price trend i.e., upwards for this chart. However, be attentive for a possible fakeout (a premature breakout) and a pullback/throwback towards the apex of the triangle. A pullback after a breakout may weaken the formation and may potentially reverse the trend. In a bull market, a Symmetrical Triangle can be expected to average a 38% gain if no pullback/throwback occurs.

Saturday, July 01, 2006

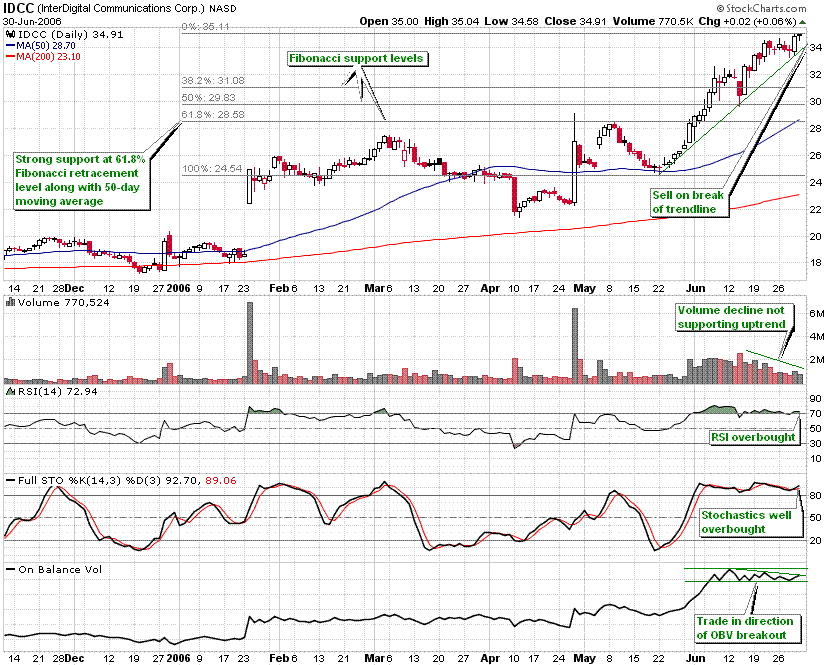
InterDigital Communications Corp. (IDCC) - Bearish Signals ?


Wireless semiconductor technology is a hot sector and bullish sentiment surrounds IDCC which looks well poised in that area. However, from a TA perspective, immediate bear signals seem to be forming. An intact uptrend since around May 22nd, seems over the past couple of weeks, to be progressing with diminishing volume. RSI is hovering over 70 which is considered overbought. Stochastics are well overbought – 80 is usually considered an overbought region. OBV looks as if it is gently making lower highs in a descending triangle fashion. Sooner than later, the uptrend will give in creating a sell signal, at which point the Fibonacci retracement levels may provide support. A good level of support may be found at the 61.8% Fibonacci retracement level of the uptrend occurring near the 50-day moving average.

Friday, June 30, 2006

Dow Jones - Inverse Head & Shoulders


The Dow seems as if it has formed a rather sneaky looking bullish Inverse Head & Shoulders pattern. The Fed rally today caused a breakout of the Neckline occurring at the 38.2% Fibonacci advancement level from the selloff low. The rally seems to have hit resistance at the 50-day moving average occuring near the 50% Fibonacci advancement level. Technically, the price projection of a Head & Shoulders formation is the distance measured from the Head to the Neckline projected from upwards from the Neckline; -this translates to a price projection of 11,500 approx. However, retracments back to the Neckline providing support are possible before heading higher. A break and close below the Neckline invalidates the formation.

Saturday, June 24, 2006

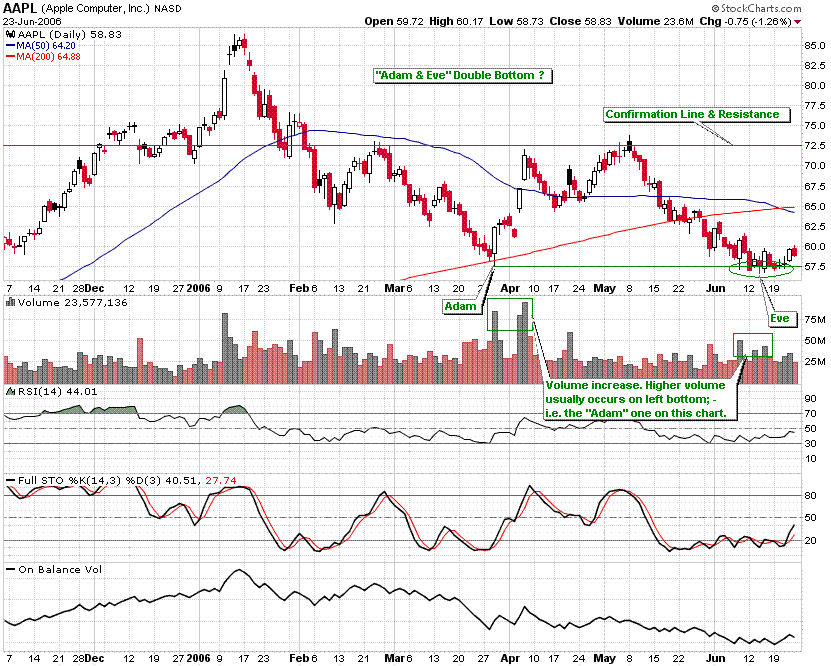
Apple Computer, Inc. (AAPL) - Adam & Eve Double Bottom ?


Apple seems to be attempting to form an Adam & Eve double bottom pattern. The left "Adam" bottom is identified with a spike. The "Eve" bottom forms gradually creating a rounded base. Higher volume on the left bottom usually indicates a stronger pattern. However, the pattern seems to be in very early stages and is confirmed on break of the Confirmation Line which serves as prior resistance. From then on, a price projection to the previous high of $85 is a possible target.

Thursday, June 22, 2006

Insteel Industries, Inc. (IIIN) - Inverse Head & Shoulders


Breaking above the 50-day moving average, IIIN looks like it has formed a bullish inverse Head & Shoulders pattern. A break of the $22 Neckline resistance will confirm the pattern at which point a buy signal is generated. For a lower-risk entry, look for a possible pullback to the Neckline after the breakout which should act as support as "old resistance becomes new support". Price projection: $28 - distance from the Head to Neckline projected upwards from the Neckline, filling a gap along the way.

Wednesday, June 21, 2006

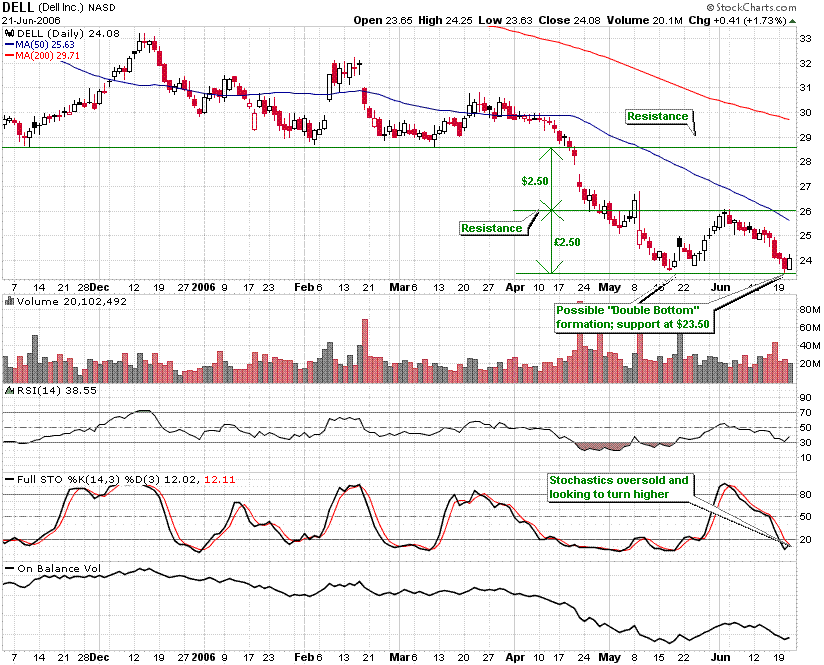
Dell Inc. (DELL) - Possible Double Bottom


Calling the bottom in Dell is like catching a falling knife. However, with stochastics oversold and looking to turn higher, it seems that a bullish Double Bottom pattern is forming. A break above $26 dollars completes the formation with support at the 50-day moving average. From then on, a possible price projection of $28.50 may provide the next level of resistance. Invalid pattern if close below support at $23.50.