Technical Analysis of Financial Markets

Saturday, September 30, 2006

Wal-Mart Stores, Inc. (WMT)


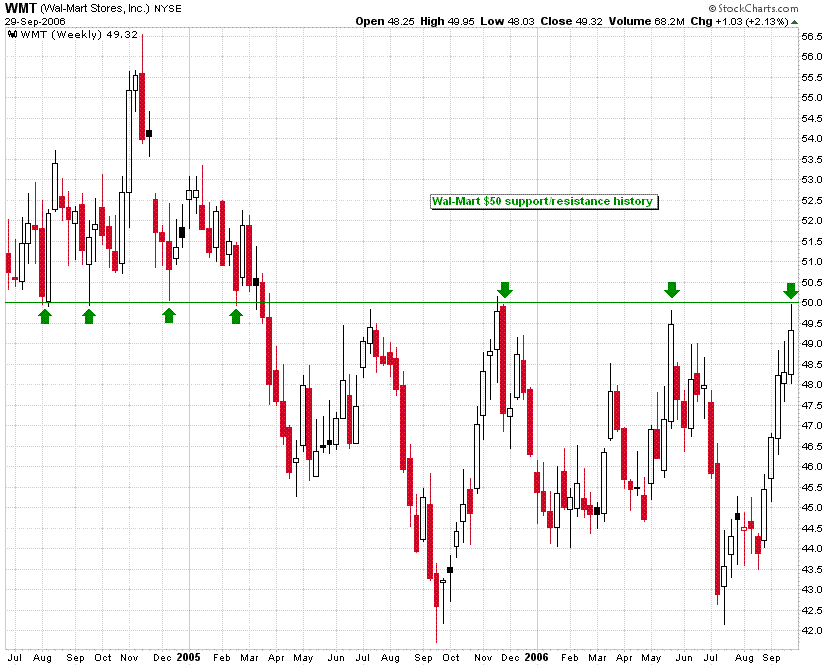
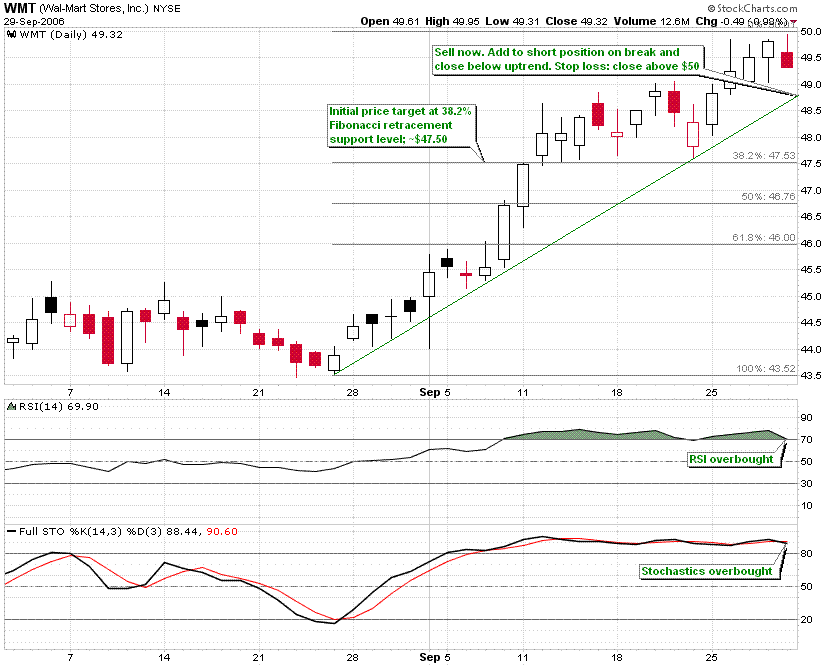
Over the last 28 months, the $50 level for Wal-Mart has served as defining resistance and support levels of bull versus bear. With current price action again hitting this $50 level as resistance and RSI and stochastics overbought, now be a good entry into a short position; -adding to the position on break and close below the uptrend. Stop loss: break and close above $50.

Thursday, September 28, 2006

Advanced Micro Devices - (AMD)


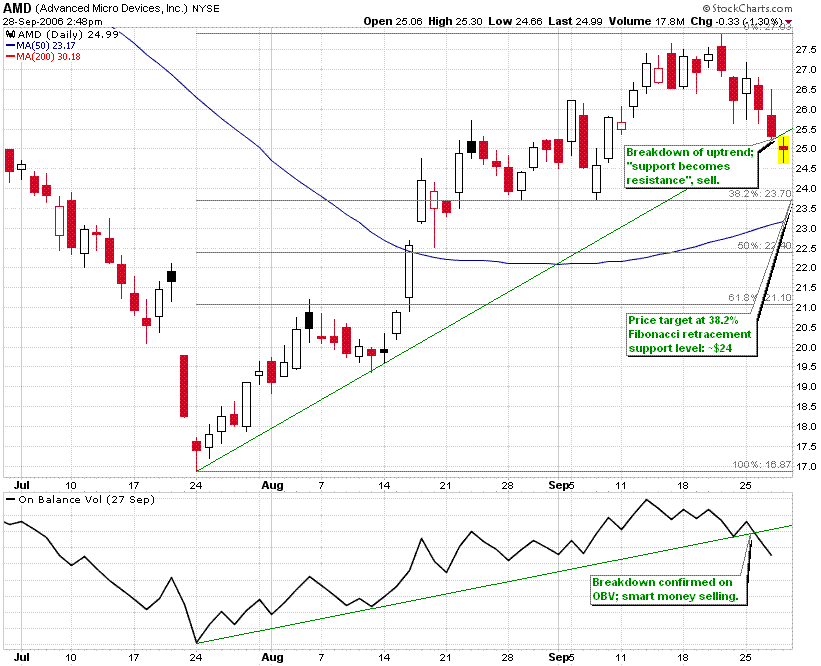
Microprocessor manufacturer AMD was downgraded today by ThinkEquity; as a consequence, price action traded lower. However, the move lower was enough to break an uptrend of a 60%-gain rally which lasted 2-months. OBV has also confirmed the breakdown. The trend-reversal may find support at Fibonacci retracement levels ~$24, ~$22.50 and $21.

Nvidia Corp. - (NVDA)


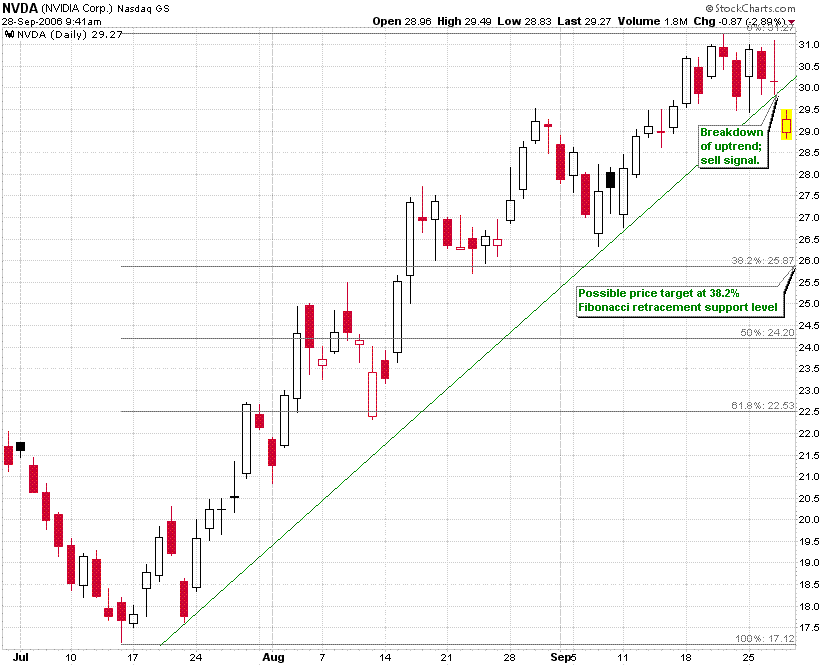
After an 80% rally in 3 months, NVDA has today broken the uptrend. Short a possible climb back towards the trendline at ~$30; “support has become resistance” trend-reversal. Sell.

Franklin Resources, Inc (BEN)


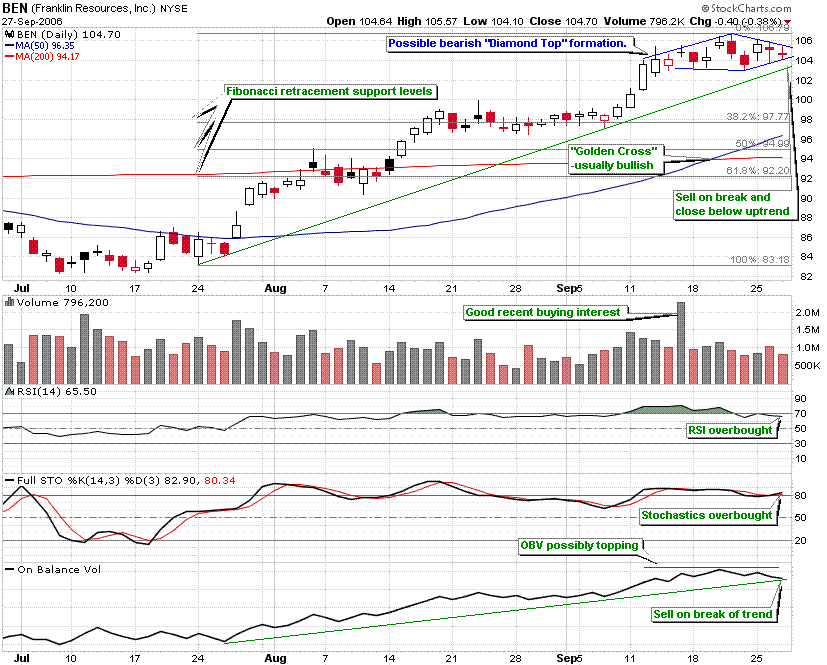
Asset management firm Franklin Templeton along with the other financials have recently hit fresh highs. A 30% rally since late July currently seems to be consolidating into a small bearish Diamond Top formation. Bullish signs: a golden cross (the shorter moving average crossing above the longer moving average) has occurred and a modest buy-volume spike. Bearish signs: RSI and stochastics seem overbought. OBV seems like it is topping; since volume precedes price, trade in direction of this indicator.

Wednesday, September 27, 2006

Humana, Inc (HUM)


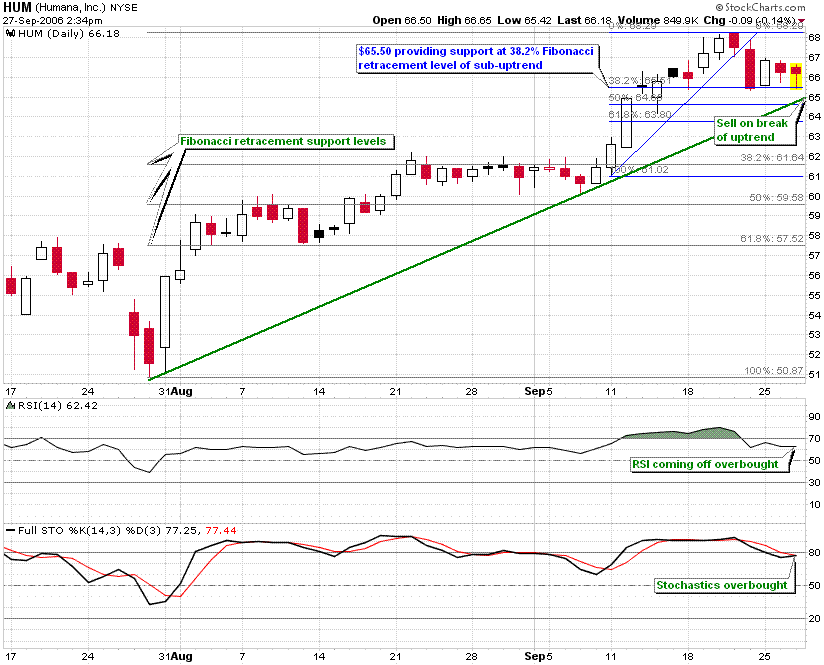
Health insurance and healthcare plans provider Humana recently hit a 52-week high. In two months it has rallied some 33%. A recent steeper sub-uptrend beginning second week of Sep ended 4 trading sessions ago and price action has currently found support at the 38.2% Fibonacci retracement level of the subtrend, or ~$65.50. Stochastics still seem overbought; a possible price target of ~$61.50 on break and close below the broader uptrend at $65.

Sunday, September 10, 2006

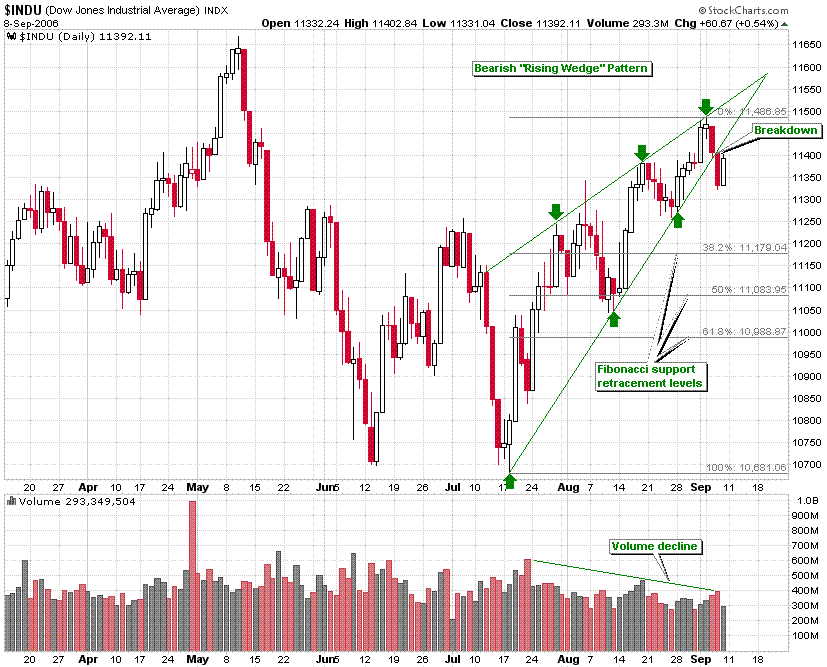
Dow Jones - Bearish Rising Wedge


The Dow looks as though it has completed a Rising Wedge formation. This pattern is bearish and usually occurs on diminishing volume. Textbooks suggest that the pattern must have at least five touches; – that is, tests of the support and resistance trend lines should occur at least five times in total. Volume should increase as the breakdown increases in magnitude. It’s typical to see a 5% decline in price after the wedge formation. Should this hold true, a price target of 10,925 may be a possibility. Watch Fibonacci retracement levels for support.

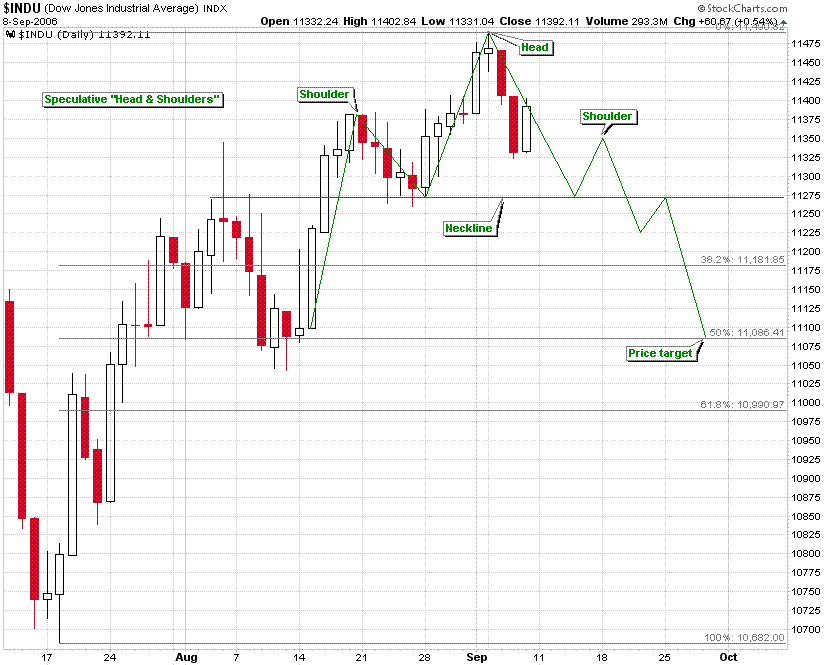
Dow Jones - Speculative Head & Shoulders

Saturday, September 02, 2006

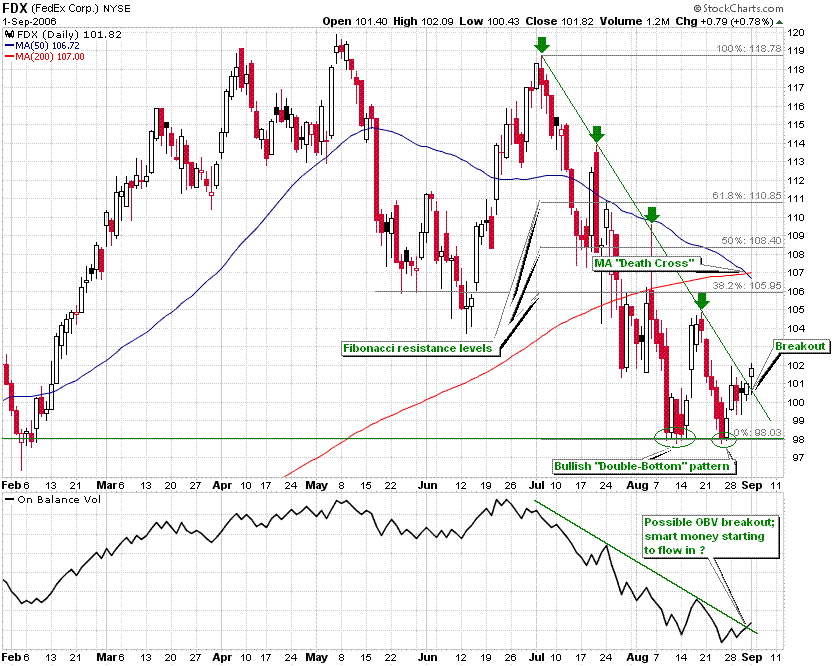
FedEx Corp. (FDX)


FedEx seems as if it is forming a bullish Double-Bottom pattern. The two-month downtrend which began in early July seems to have been broken; today saw a breakout which may signal a bullish trend reversal. Surpassing resistance at $105 will confirm the Double-Bottom pattern setting up a price target of $110. It may be worth noting that the 200-moving average has crossed above the 50-day moving average--known as a “Death Cross”; since long-term indicators carry more weight, this may indicate a bearish signal.

Friday, September 01, 2006

SanDisk Corp. (SNDK)


Since gapping-up over a month ago, SanDisk has rallied almost 60%. However, with overbought stochastics at their highest attempting a crossover and RSI hovering above 70 for the first time in months, overbought signals seem abound. Historically accompanying more sell volume than buy, $60 has interchanged between support and resistance and is currently serving as resistance. A short-sell at current levels near $60 may serve as a low-risk entry to a possible target towards the uptrend support at $55.50-$56. A break and close below the uptrend support may signal the end of the rally and a trend reversal. From then on, watch Fibonacci retracement levels for support.

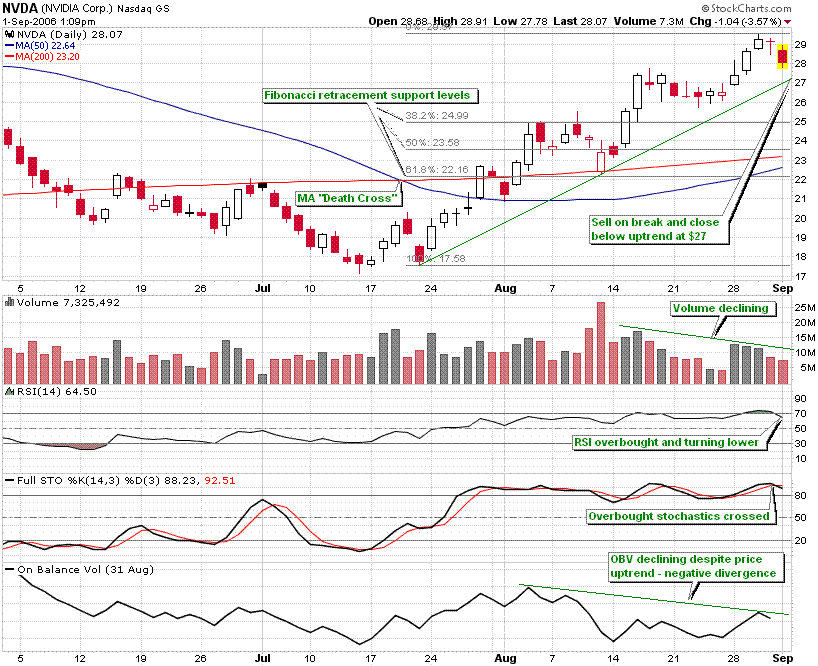
NVIDIA Corp. (NVDA)


NVIDIA has rallied some 60% in just over a month. Along the way, stochastics have been signalling overbought conditions whilst RSI remained moderate. However, during the past couple of trading sessions RSI has been hovering above 70 for the first time since the rally began signalling overbought conditions. OBV has been declining for the most part of the rally implying a negative divergence; smart money may be offloading. A failure to sustain a close above $27 to maintain the uptrend may indicate a trend reversal. Watch Fibonacci retracement levels for support beginning with $25.

Wednesday, August 16, 2006

AMEX Oil Index (XOI) - Negative Divergence


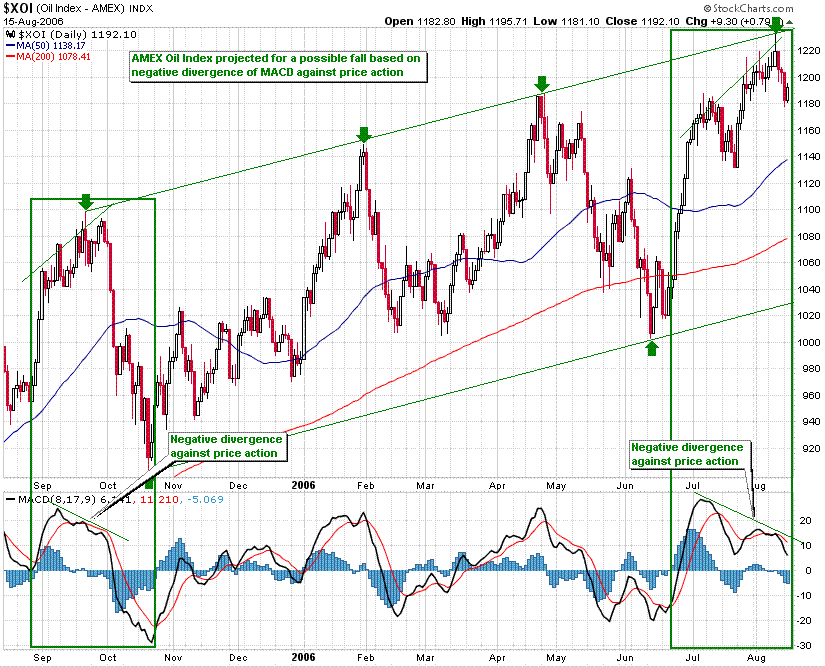
During early Sep and late Oct 2005, the MACD indictor formed a negative divergence against price action for nearly 2 months; subsequently the AMEX Oil Index plunged. The same negative divergence of MACD against price action on a similar 2 month scale is currently in progress beginning early July 2006. A break of support at 1180/1160 may signal a move lower on a similar scale as during Oct 2005 bringing price action down to the lower end of the trading range; oil stocks may be poised to fall.

Saturday, August 12, 2006

Exxon Mobil Corp. (XOM)


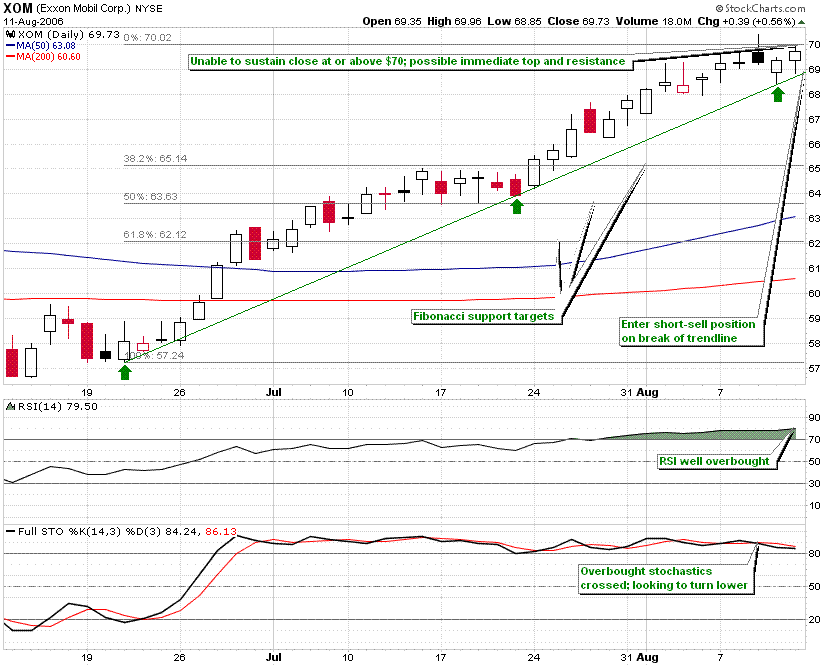
ExxonMobil recently hit an all-time high of over $70 but has been unable to close at or above that level. A 2-month uptrend driven by record $10US billion earnings profit news due to record oil prices seems intact. However indictors such as the RSI are signalling well overbought conditions, and overbought stochastics have crossed attempting to turn lower. Short-sell on break of the uptrend for a lower-risk entry. Fibonacci retracement levels of the trend may serve as possible support levels. Stop-loss: break & close above $70. Deutsche Bank has a "buy" rating (July 28th) on ExxonMobil with a target price raised from $67 to $75.

Thursday, August 10, 2006

Cisco Systems, Inc (CSCO)


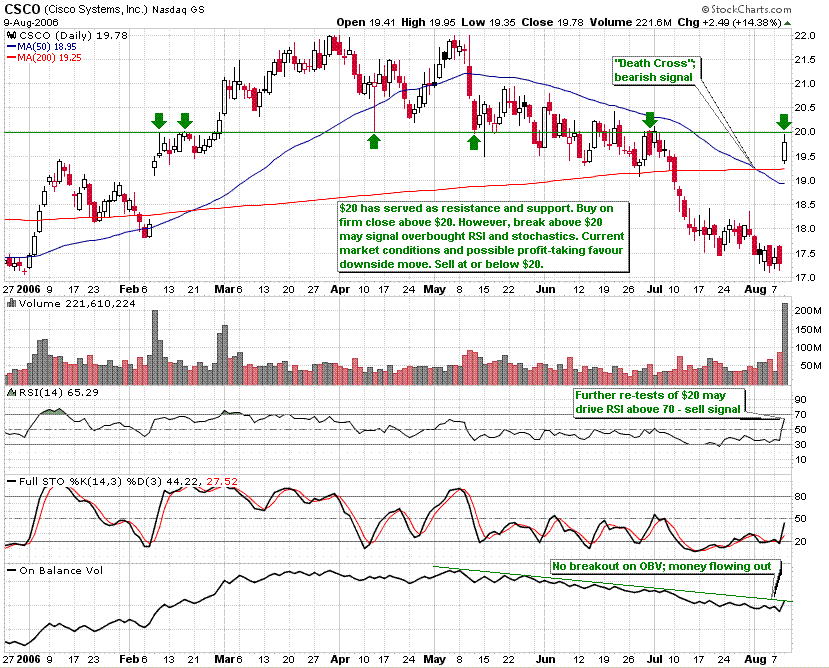
Positive earnings news from Cisco sent the stock surging 15%; however price action remained below $20 and OBV is yet to show signs of fresh buying interest. The $20 level has historically served as support and resistance. Should $20 act as resistance again, current market conditions and profit-taking may drive prices lower. The 200-moving average has crossed above the 50-day moving average; since long-term indicators carry more weight, this may indicate a bearish signal.

Tuesday, August 08, 2006

Dow Jones - Day before the Fed


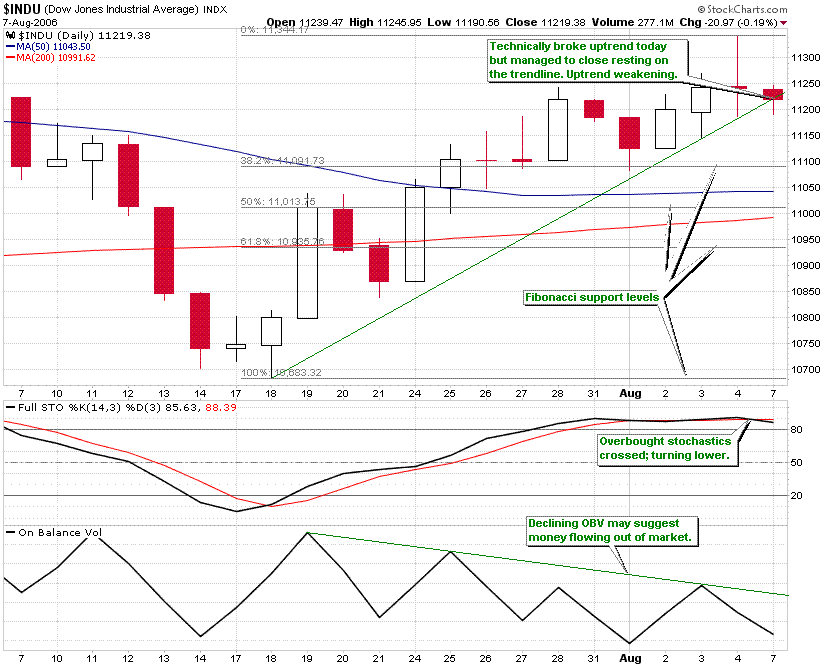
Today penetrated a 13-day uptrend but managed to close the session resting on the trendline. OBV has been declining since the uptrend began implying a divergence. Stochastics are signalling overbought conditions and have crossed looking to turn lower. Technically, the Dow seems to be weakening and ready to end the current uptrend. However, the Fed’s decision on interest rates tomorrow will of course steer the market.

Friday, August 04, 2006

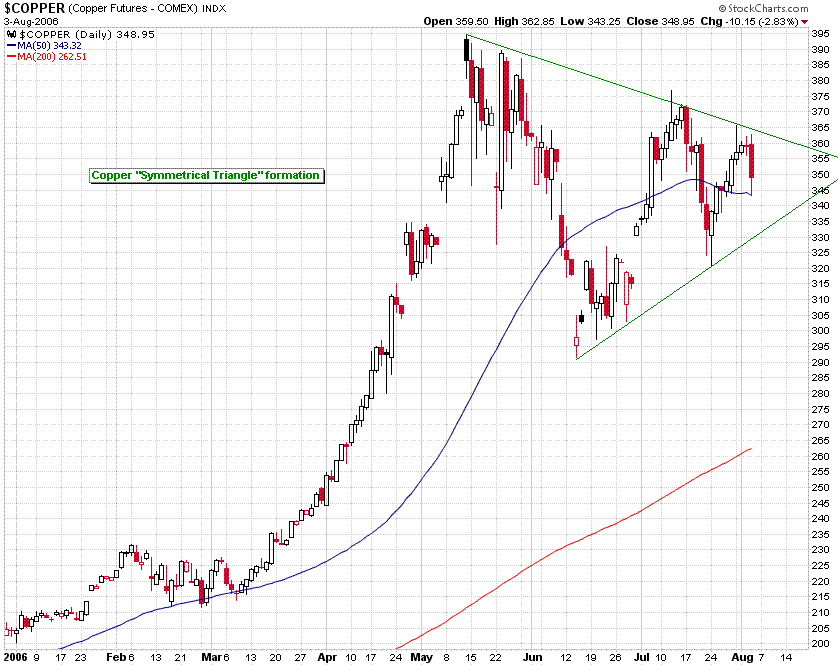
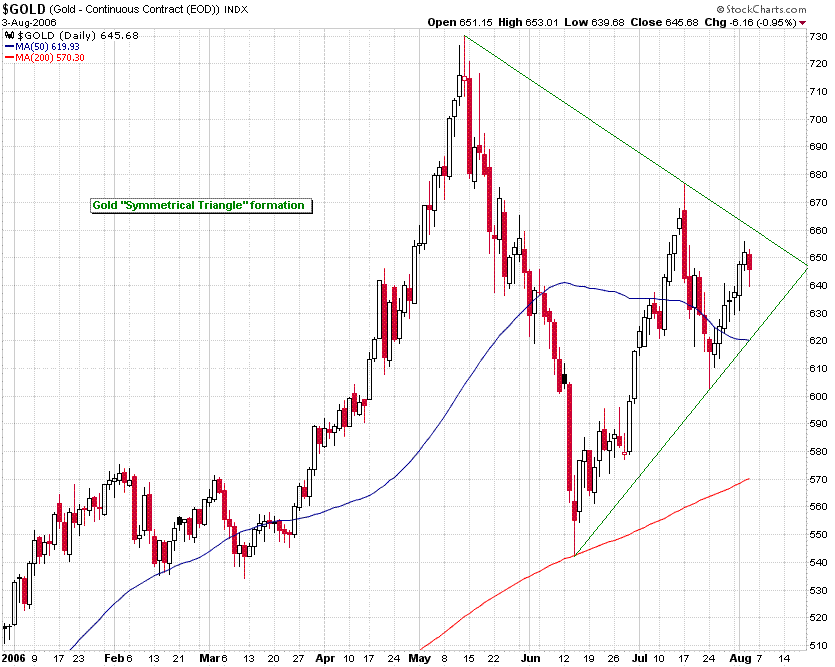
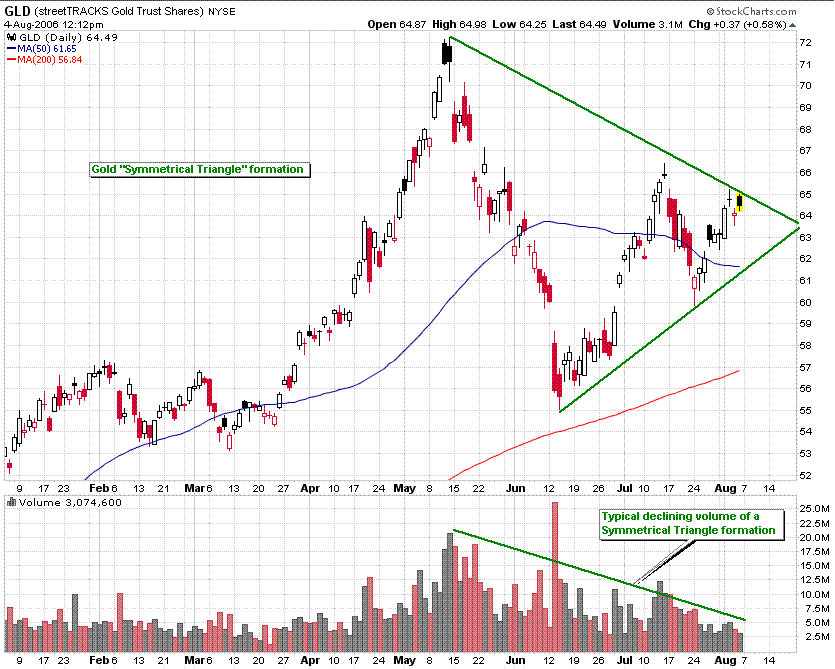
Gold & Copper - Metals Symmetrical Triangle

After a parabolic rise in commodities, metals copper and gold seem to be consolidating into a Symmetrical Triangle formation. Breakout usually favours the direction of the previous price trend (i.e. upwards); however, the breakout can occur in either direction - trade in the direction of breakout. Gold can be traded using the streetTRACKS Gold ETF listed on the NYSE under symbol GLD. Is there a copper ETF available?


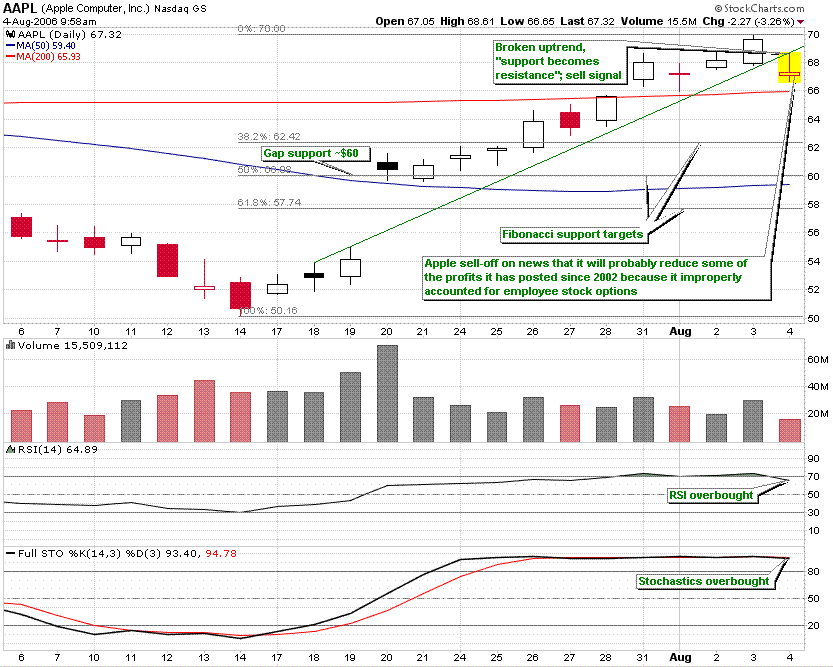
Apple Computer, Inc (AAPL)


The recent uptrend in Apple has been broken due to a sell-off on news that it will probably reduce some of the profits it has posted since 2002 because it improperly accounted for employee stock options. With RSI and stochastics signaling overbought conditions, a short-sell trade to Fibonacci retracement support levels may be possible. The 50% Fibonacci retracement level at $60 also serves as gap support. Stop-loss close above $70.

Thursday, August 03, 2006

Bayer AG (BAY)


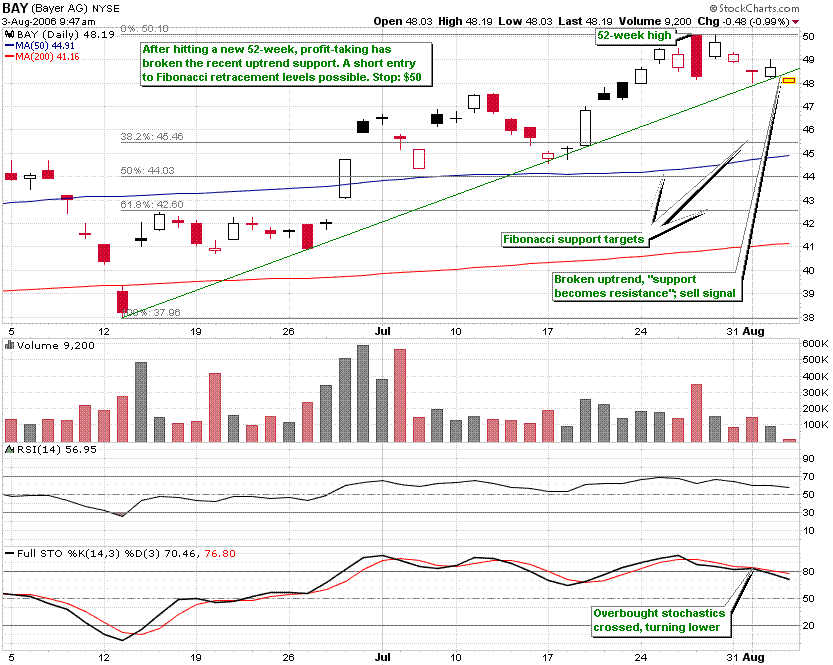
German drug manufacturer Bayer has recently hit a new 52-week high and may be subject to some profit-taking; overbought stochastics have crossed and may signal lower prices. The recent 2-month uptrend has today been breached. Current prices may provide entry to a possible short position targeting Fibonacci retracement levels. Stop-loss close above $50.
Wednesday, August 02, 2006

Pfizer, Inc (PFE)


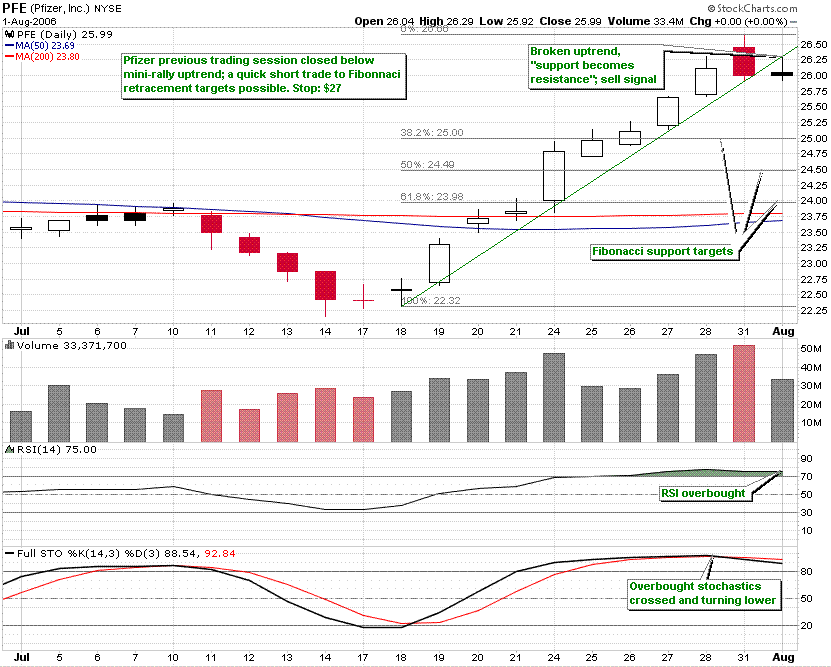
Jeffrey Kindler takes over as Pfizer’s CEO from Henry McKinnell and the stock stages a mini-rally. The previous trading session technically broke and closed below the uptrend support of the mini-rally and with RSI overbought, and overbought stochastics crossing looking to turn lower, now may be a good entry for a short position. Watch Fibonacci retracement levels for targets. Stop-loss if close above $27.

Monday, July 31, 2006

FedEx Corp. (FDX)


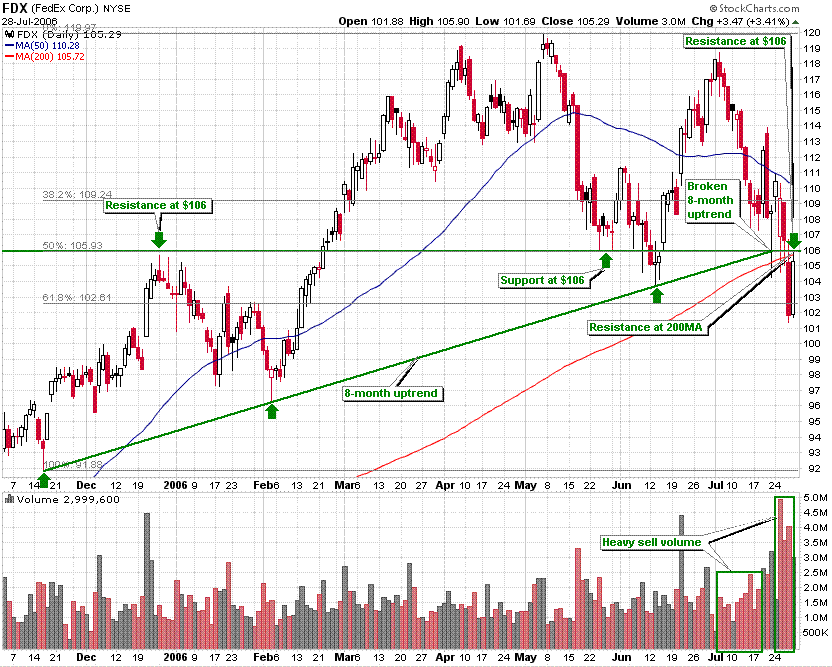
Since breaking an 8-month uptrend on July 21st, FedEx is currently trading below the 200-day moving average. $106 has served as resistance before during late December 2005 and as support during late May 2006. Currently, this level, $106, is again serving as resistance and is also the 50% Fibonacci retracement level of the 8-month uptrend. With recent heavy sell volume, bearish until firm close above $109 or 38.2% Fibonacci level.

Friday, July 28, 2006

Dow Jones – Double Bottom (almost complete)


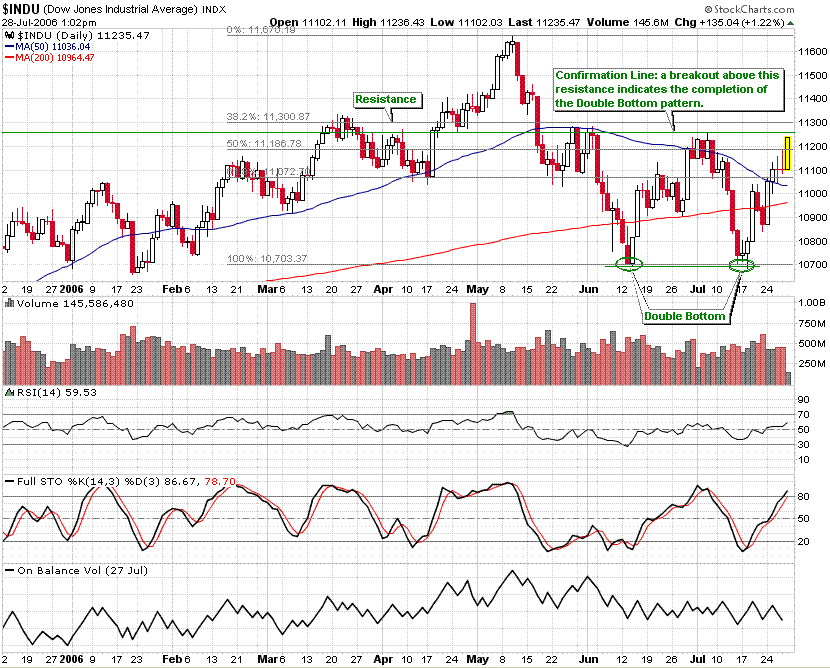
The Double Bottom bullish reversal pattern the Dow has been forming is almost complete. A break and close above approx 11,250 will confirm the pattern at which point buyers enter. However, watch 11,300 marking a Fibonnaci level which has served as resistance before during late March. A possible turn back lower below the Confirmation Line after breaking above it may indicate a failed pattern.