Technical Analysis of Financial Markets

Wednesday, May 31, 2006

Honeywell Intl (HON) - Extend Short Position ?


Honeywell short going well, Double Top price projection to $40 complete. Should take profits but a 5% decline to the trendline and 200-day moving average in ths climate looks possible.

Tuesday, May 30, 2006

Genentech, Inc. (DNA) - Triple Bottom Reversal ?


This one is awkward; it looks as if Genentech has bottomed-out over the past month creating a Triple Bottom. The immediate resistance and 50-day moving average seems breached. However, the main seven month downtrend seems intact. Furthermore, the on balance volume indicates that money is flowing out. A firm break and close above say $83.50 should see this test the 200-day moving average around $87-$88. Otherwise, a selloff at $83. Cross-post: http://www.thebulltrader.com/forums/index.php?topic=169.0

Dow Jones - Testing Support and Resistance

Interesting day today, the Dow plunged some 180 points forming a tall red candlestick with no wicks. The Dow traded exactly between the Oct 2005 resistance from where it opened and closed at the day low right near the 38.2% Fibonacci retracement level from the year high; wiping-out the gains of three day rebound rally. This week's economic data is either going to breach the support or breakthrough the resistance and may set the tone for June's market direction; watch out for the FOMC minutes 7PM (UK-time) spike which ever way it may be.

Monday, May 29, 2006

Dow Jones - Analysing the Rebound


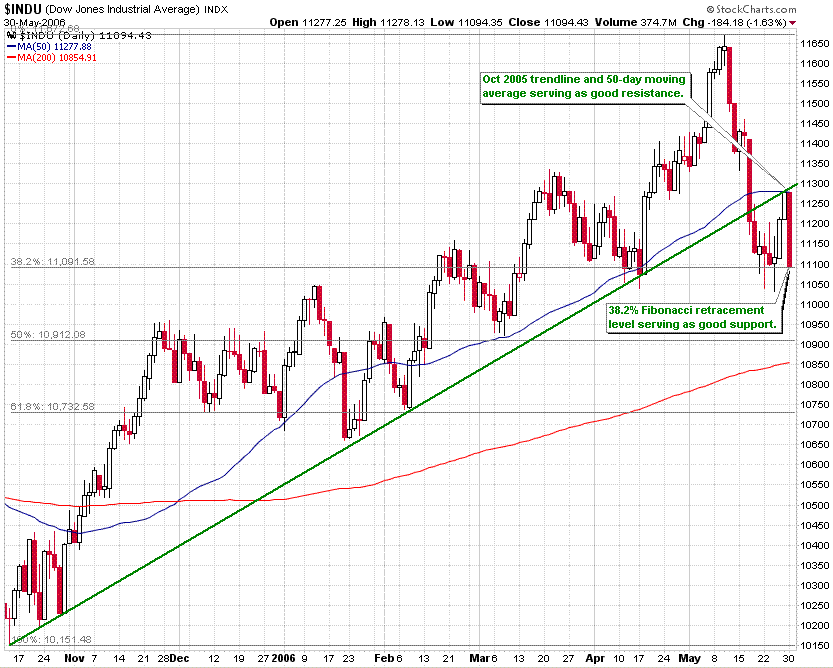
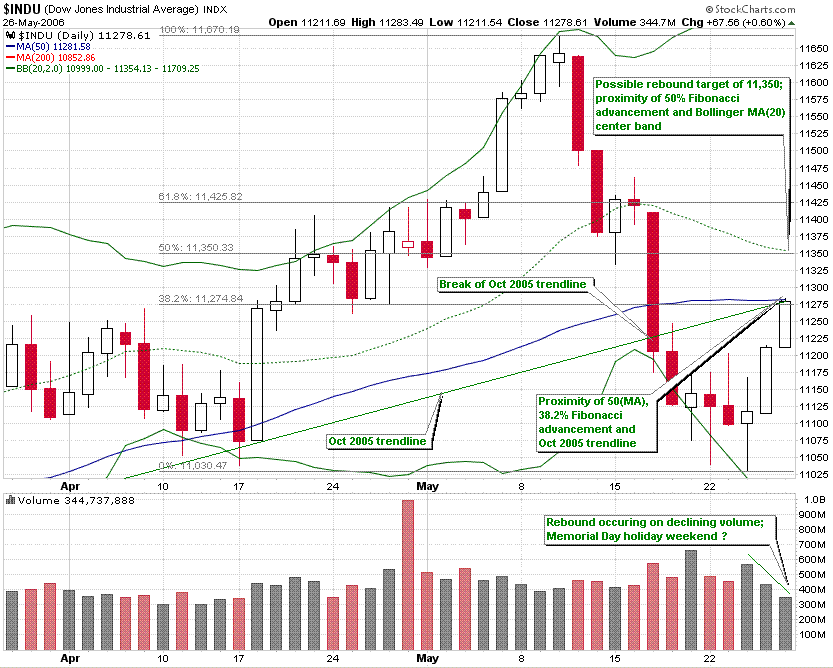
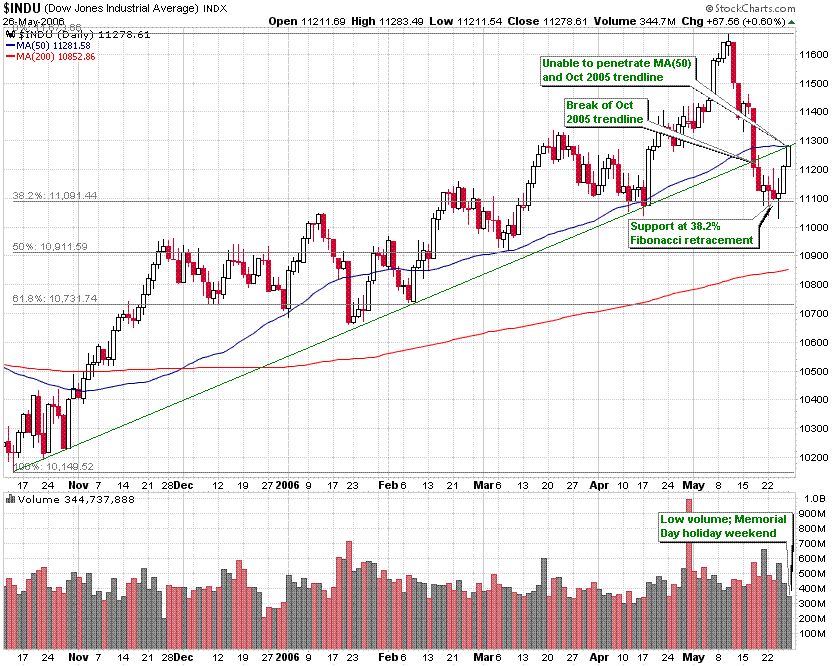
Perhaps due to the approaching Memorial Day holiday weekend, the three day rebound of the sell-off occurred on declining volume. Friday closed within the proximity of the 50-day moving average, the Oct 2005 trendline and 38.2% Fibonacci advancement from the sell-off low. Prior trendlines which become violated usually serve as new resistance, and if the Street doesn’t like this week’s data on manufacturing, employment growth and worker productivity, then this could be a good entry point for shorts. Otherwise, the next level of resistance looks to be around 11,350; this is a 50% Fibonacci advancement from the sell-off low and coincides with a 20-day moving average Bollinger Band centre.

Sunday, May 28, 2006

Dow Jones - Analysing the Drop

The recent "sell in May and go away" drop that lasted two weeks beginning on 11/05/2006 wiped some 5.5% off the Dow. A sharp correction dictates a possible 10% pullback; so in context, we may only be half way through if a steep correction is on the cards. The drop sliced through an uptrend that has been intact for the past seven months which started back in mid-Oct 2005, but has found support and bounced off the 38.2% Fibonacci retracement level. Since then, the Dow has managed to rebound but has been unable to penetrate the Oct 2005 trendline and 50-day moving average. It may seem that the old Oct 2005 trendline support has become new resistance.

Saturday, May 27, 2006

Hansen Natural Corp. (HANS) - Descending Triangle or Flag ?

This week, HANS made second place on IBDs 10 Highest-Rated Stocks. Over the course of the week, HANS has been consolidating and it first looked though as if a bearish Descending Triangle pattern was in formation:

However, as the week progressed, the Decending Triangle formation has evolved to a bullish Flag formation:

Cross-post at The Bull Trader: http://www.thebulltrader.com/2006/05/26/hans-bull-flag/

Boeing Co. (BA) - Head & Shoulders Top


Boeing seems to be forming a bearish Head & Shoulders top formation. A break below the neckline at $82 may confirm the formation; at which point, the projected price of the formation may be around $77. Price projection: peak of head (~$89) minus neckline (~$82) is a distance of around $7; project $7 downward from the neckline at $82 to achieve a price target of $75. However, a 50% Fibonacci retracement at ~$77 may provide support. Cross-post at The Bull Trader: http://www.thebulltrader.com/2006/05/25/ba-head-shoulders-top/