Technical Analysis of Financial Markets

Monday, July 31, 2006

FedEx Corp. (FDX)


Since breaking an 8-month uptrend on July 21st, FedEx is currently trading below the 200-day moving average. $106 has served as resistance before during late December 2005 and as support during late May 2006. Currently, this level, $106, is again serving as resistance and is also the 50% Fibonacci retracement level of the 8-month uptrend. With recent heavy sell volume, bearish until firm close above $109 or 38.2% Fibonacci level.

Friday, July 28, 2006

Dow Jones – Double Bottom (almost complete)


The Double Bottom bullish reversal pattern the Dow has been forming is almost complete. A break and close above approx 11,250 will confirm the pattern at which point buyers enter. However, watch 11,300 marking a Fibonnaci level which has served as resistance before during late March. A possible turn back lower below the Confirmation Line after breaking above it may indicate a failed pattern.

Starbucks Corp. (SBUX)


Since breaking the 10-month uptrend in early July at $36, SBUX seems to be trading between the 200-day moving average and 50-day moving average; or $33 and $36. A break of the current support at $33 should see next support at $32 filling a gap along the way. A failure of the $32 support level may see price action consolidate at around $30. Not bullish until break above $37 filling a gap along the way and climbing back above the 10-month uptrend. Declining OBV suggests smart money is offloading.

Monday, July 17, 2006

Transocean, Inc. (RIG) – Bearish Head & Shoulders Top


On this weekly chart, RIG seems like it is currently forming the right-shoulder of a bearish Head & Shoulders top formation. A lower-risk entry for a short-sell position may present itself on break of the Head & Shoulders Neckline at $70. This break will also take-out an uptrend that has been intact for the past 24 months.

Tuesday, July 11, 2006

Union Pacific Corp. (UNP) - Bearish Breakdown ?


Not quite a Symmetrical Triangle, but coiling like one, UNP seems to be tightening-up preparing for a breakout. With the current uptrend forming on diminishing volume and the OBV suggesting smart money flowing out, a breakout favours the downside. Overall wider and general market direction may decide the breakout direction.

Monday, July 10, 2006

Dow Jones - Narrowing Uptrend


Previously since around April, the 38.2% Fibonacci retracement level from the highs provided Neckline support of a Head & Shoulders formation. In early June, the Oct2005 uptrend met the 38.2% Fibonacci retracement level and was broken starting the second leg of the selloff wave. Towards the middle of June, this level served as good resistance during a bounce. Friday closed almost exactly at this 38.2% Fibonacci retracement level. This level, the 38.2% Fibonacci retracement level, approx just under 11100, seems to be providing good support & resistance. If it continues to act like it has been, tomorrow should see a bounce from Friday’s close. Should the current uptrend continue from the selloff lows, then between this uptrend and the Oct2005 trendline, a narrowing trading range converges at approx 11320 which may serve as considerable resistance as before during the end of middle March. This narrowing trading range may be confirmed with declining volume.

Tuesday, July 04, 2006

Google, Inc. (GOOG) - Symmetrical Triange ?


This is a weekly chart of Google since IPO-ing. After peaking in Jan 2006, a 6-month period of consolidation creating a Symmetrical Triangle seems to be forming accompanied by declining volume; – a usual trait in any typical coiling formation. A breakout usually favours the direction of the previous price trend i.e., upwards for this chart. However, be attentive for a possible fakeout (a premature breakout) and a pullback/throwback towards the apex of the triangle. A pullback after a breakout may weaken the formation and may potentially reverse the trend. In a bull market, a Symmetrical Triangle can be expected to average a 38% gain if no pullback/throwback occurs.

Saturday, July 01, 2006

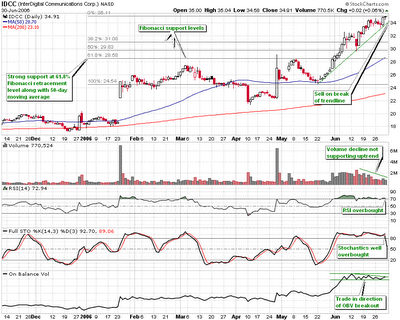
InterDigital Communications Corp. (IDCC) - Bearish Signals ?


Wireless semiconductor technology is a hot sector and bullish sentiment surrounds IDCC which looks well poised in that area. However, from a TA perspective, immediate bear signals seem to be forming. An intact uptrend since around May 22nd, seems over the past couple of weeks, to be progressing with diminishing volume. RSI is hovering over 70 which is considered overbought. Stochastics are well overbought – 80 is usually considered an overbought region. OBV looks as if it is gently making lower highs in a descending triangle fashion. Sooner than later, the uptrend will give in creating a sell signal, at which point the Fibonacci retracement levels may provide support. A good level of support may be found at the 61.8% Fibonacci retracement level of the uptrend occurring near the 50-day moving average.