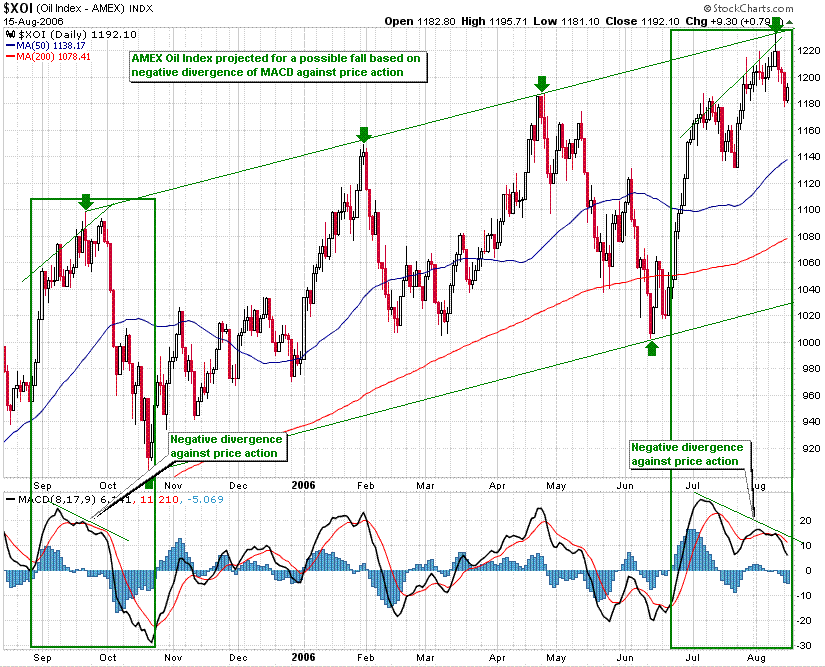
During early Sep and late Oct 2005, the MACD indictor formed a negative divergence against price action for nearly 2 months; subsequently the AMEX Oil Index plunged. The same negative divergence of MACD against price action on a similar 2 month scale is currently in progress beginning early July 2006. A break of support at 1180/1160 may signal a move lower on a similar scale as during Oct 2005 bringing price action down to the lower end of the trading range; oil stocks may be poised to fall.