Technical Analysis of Financial Markets

Wednesday, April 23, 2008

FTSE Elliot Wave ?


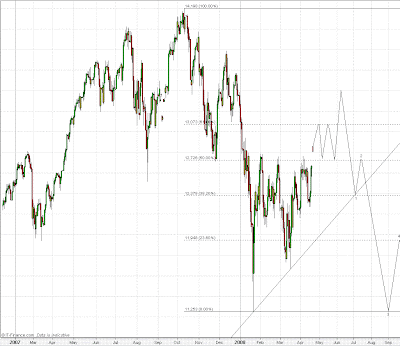
The FTSE has ostensibly completed a bearish 5-wave Elliot cycle marking a low on 19 March. Current price action is nearing completion of an a-wave bullish a-b-c correction at the 50% Fibonacci retracement level of the 5-wave Elliot cycle. Presumably, bearish b-wave may instigate the creation of the right Shoulder of a bullish inverse Head & Shoulders formation. Finally, bullish c-wave ought to drive price action through the 50% Fibonacci retracement level which also serves as Neckline resistance of the inverse Head & Shoulders formation.

Saturday, April 19, 2008

Bull or Bear ?

Thursday, April 03, 2008

FTSE Fibonacci Fans & Retracements


The 23.6% Fibonacci retracement level projected from the beginning of the 2003 bull market is currently serving as resistance on the FTSE 100 index. Enter short postion with a stop-loss on a weekly close above the 23.6% Fibonacci level; next immediate resistance at 6000 and then the underside of median Fibonacci fan trendline.

Walt Disney Co. (DIS)


Price action of Dow component, The Walt Disney Company, is currently consolidating into a speculative bullish inverse Head & Shoulders pattern. A close above Neckline resistance at $33.25 may provide confirmation of a low-risk entry point into a long position with a price target towards approx $36.

Wednesday, April 02, 2008

Dow Jones 12,770 Level


The 12,770 level on the Dow has served as support and resistance over the last 14-month period. Current price action may see a retest of the 12,770 level, at which point, an entrance into a short postion may serve as a low-risk trade. Long on a weekly close above 12,770.